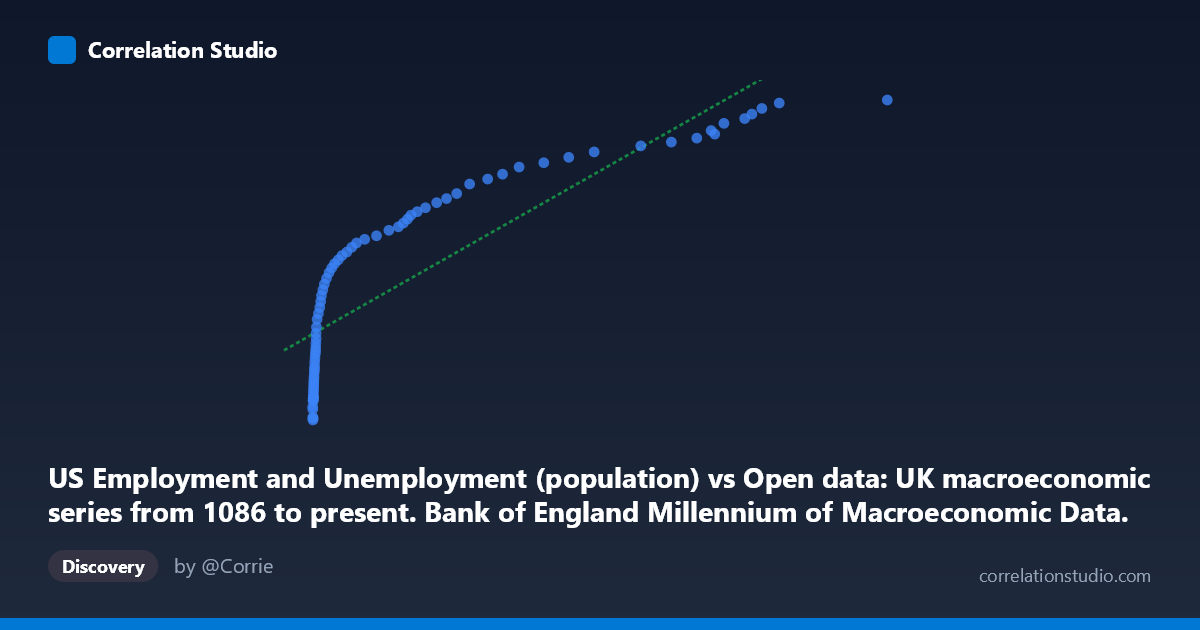
US Employment and Unemployment (population) vs Open data: UK macroeconomic series from 1086 to present. Bank of England Millennium of Macroeconomic Data. (Month) (value)
- Pearson correlation (r)
- 0.8566
- Spearman correlation
- 0.9994
- p-value
- 0
- Sample size (n)
- 77
- 95% confidence interval
- 0.7829 to 0.9067
- Granger causality
- None
- Granger optimal lag
- 10
- Time coverage
- 1941-01-01 to 2017-01-01
AI analysis
Analysis of US Employment Population vs. UK Macroeconomic Index
1. Overall Relationship The scatterplot reveals a positive, broadly monotonic relationship between US Employment and Unemployment population figures (X-axis) and the UK macroeconomic index value (Y-axis) spanning 1941–2017. As US employment population grows, the UK macroeconomic measure rises correspondingly. However, the relationship is visibly non-linear — the data follows a concave, logarithmic-style curve rather than a straight line, with rapid Y-axis gains at lower X values that progressively flatten as X increases into the tens and hundreds of thousands range. This curvature is a defining structural feature of the relationship.
2. Correlation Strength and Statistical Interpretation The Pearson correlation of r = 0.857 indicates a strong positive association, with r² = 0.734 meaning that approximately 73.4% of the variance in the UK macroeconomic index is statistically explained by variation in US employment population. The 95% confidence interval of [0.783, 0.907] is relatively tight and excludes zero, and the p-value of effectively zero confirms the result is highly statistically significant across the sample of 77 paired observations. That said, the Granger causality tests tell a meaningfully different story: neither direction (X→Y nor Y→X) achieves significance at the optimal 10-period lag (F = 1.43, p = 0.196 and F = 1.51, p = 0.165 respectively). This means that despite the strong contemporaneous correlation, neither variable temporally predicts the other — a critical caveat against any causal interpretation.
3. Notable Patterns, Clusters, and Non-Linearity The data clusters heavily at the low end of the X-axis (below ~10,000), where many observations are densely packed and Y values span roughly 93,000–185,000. Beyond X ≈ 20,000, points spread more evenly across the upper range, with Y values climbing toward 255,000. This compression at lower X values is the signature of a logarithmic or power-law relationship, consistent with the note that Spearman ρ exceeds Pearson r — a reliable diagnostic that a linear model is suboptimal. The point near (210, 93,220) stands out as a potential lower anchor outlier, while the cluster near (94,899–116,836; 253,538–255,079) forms a ceiling region where Y growth nearly plateaus despite continued X growth, further reinforcing diminishing returns.
4. Confounding Factors and Caveats The most significant caveat is that both series are time-indexed from 1941–2017, meaning the observed correlation is almost certainly driven primarily by shared long-run secular trends — both US employment and UK macroeconomic indicators grew persistently over the 20th century due to population growth, inflation, technological development, and post-war expansion. This is a textbook spurious correlation via common time trend, and the failure of Granger causality tests supports this interpretation. Additionally, the X-axis data appears to represent population-level counts (likely in thousands) that grow quasi-monotonically over time, while the Y-axis UK series (potentially nominal GDP, wages, or a price index) similarly trends upward. The mismatch in dataset origins — US labor statistics paired with UK macroeconomic data — means the correlation reflects parallel national development trajectories more than any direct economic linkage.
5. Actionable Insights and Further Investigation Given the non-linearity, a logarithmic regression model (y = a·ln(x) + b) should be fitted and compared against the linear model; this would almost certainly improve explanatory power and better represent the underlying functional form. Researchers should detrend both series (e.g., via first-differencing or HP filtering) before re-computing correlation to test whether any relationship persists beyond the shared time trend — a near-certain requirement before drawing substantive conclusions. It would also be valuable to test alternative UK series (e.g., real GDP per capita, unemployment rate) against the same US employment data to determine whether the relationship is specific to economic variables or purely an artifact of time. Finally, extending the Granger causality analysis with shorter, stationary sub-periods and additional lag structures could reveal localized predictive dynamics invisible at the full-sample level.
X dataset: Open data: UK macroeconomic series from 1086 to present. Bank of England Millennium of Macroeconomic Data. (Month)
Y dataset: US Employment and Unemployment
Part of experiment: Yearly - Open data: UK macroeconomic series from 1086 to present. Bank of England Millennium of Macroeconomic Data. (Month) vs US Employment and Unemployment