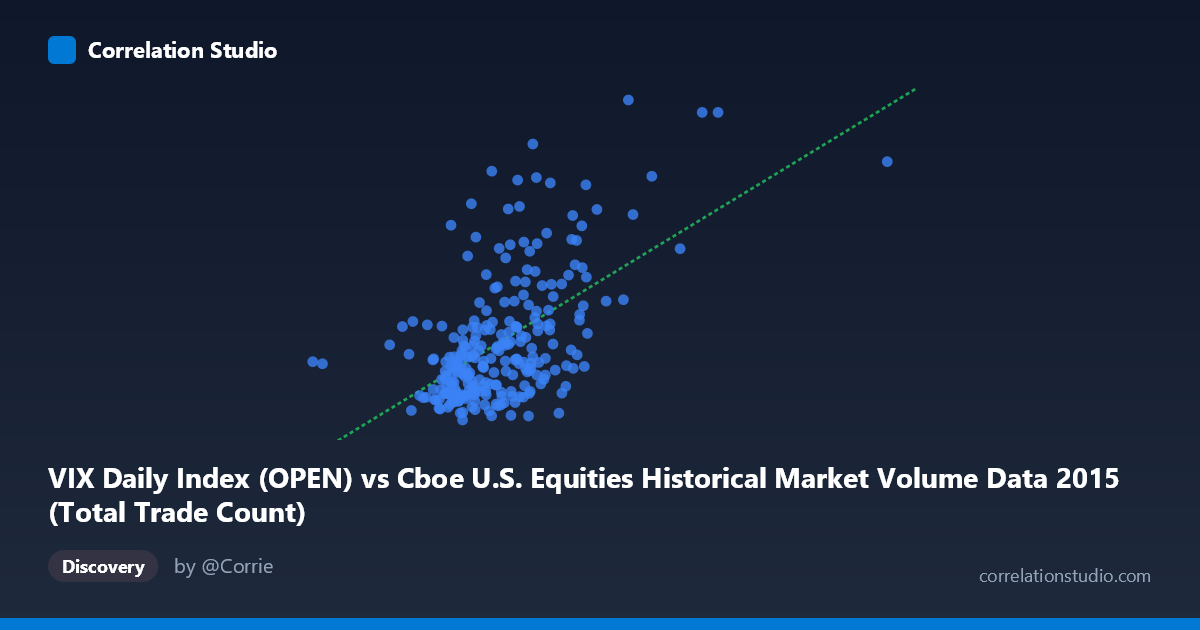
VIX Daily Index (OPEN) vs Cboe U.S. Equities Historical Market Volume Data 2015 (Total Trade Count)
- Pearson correlation (r)
- 0.5638
- Spearman correlation
- 0.486
- p-value
- 0
- Sample size (n)
- 252
- 95% confidence interval
- 0.4732 to 0.6426
- Granger causality
- None
- Granger optimal lag
- 1
AI analysis
Analysis: VIX Open vs. U.S. Equities Total Trade Count (2015)
Relationship Overview The scatterplot reveals a moderate positive relationship between the CBOE Volatility Index (VIX) daily open values and total trade counts in U.S. equities markets throughout 2015. As the VIX rises — signaling greater expected market volatility — trading activity as measured by total trade count tends to increase as well. This is intuitively consistent with market microstructure theory: periods of elevated uncertainty drive more active participation, hedging, and repositioning across market participants. The linear regression equation (y = 4.84e-6·x + 4.68) confirms this positive slope, though the relationship is clearly not tight, with considerable dispersion around the regression line.
Correlation Strength and Statistical Framing The Pearson correlation of r = 0.564 indicates a moderate positive association, but the r² of 0.318 is the more sobering metric — it means that only about 31.8% of the variance in trade count is explained by the VIX open level. Nearly 70% of the variation in trading activity is attributable to other factors entirely. The 95% confidence interval for r of [0.473, 0.643] is reasonably tight given the sample size of 252 paired observations drawn from a population of 3,302, and the p-value of effectively zero confirms this correlation is highly unlikely to be a chance finding. However, statistical significance here should not be conflated with practical explanatory power — the relationship is real but far from deterministic. Critically, the Granger causality tests are both non-significant (X→Y: F = 0.003, p = 0.955; Y→X: F = 0.079, p = 0.780), meaning neither variable reliably predicts the other in the subsequent period at a one-day lag. This suggests the relationship is largely contemporaneous rather than directionally predictive — VIX and trade volume move together on the same day but knowing one does not help forecast the next day's value of the other.
Notable Patterns, Clusters, and Outliers The sample points reveal a clear clustering of observations in the lower-left region, roughly where VIX opens between ~1.7M–2.7M and trade counts fall between 12–18, reflecting the many "calm" trading days that dominated much of 2015. There is a notable upper-right dispersion where both variables are elevated simultaneously — points such as (4,083,023; 31.13) and (3,907,922; 22.55) stand out as potential high-volatility days, likely corresponding to the August 2015 market selloff. The point (997,371; 15.44) is a clear outlier on the low-VIX end, suggesting an unusually quiet volume day. The spread of Y-values at any given X level is wide, particularly in the mid-range of X, indicating heteroscedasticity — the variance in trade count grows as VIX increases, which violates a key assumption of ordinary least squares regression and may cause the linear model to underperform at the extremes.
Confounding Factors and Caveats Several confounding factors complicate direct causal interpretation. First, day-of-week and calendar effects (e.g., lower volume on Fridays, holidays, or options expiration weeks) influence both VIX and trade counts independently. Second, VIX itself is derived from options prices rather than equity volume, so the correlation may partly reflect a shared sensitivity to underlying news events rather than a direct mechanism. Third, the dataset is confined to a single calendar year (2015), which limits generalizability — 2015 included a distinctive volatility spike in August, and that cluster of extreme observations may be disproportionately inflating the correlation. Fourth, the aggregation of all U.S. equities exchanges and TRFs into a single trade count figure masks potential heterogeneity across venues that may respond differently to volatility regimes.
Actionable Insights and Further Investigation Practitioners interested in using VIX as an anticipatory signal for market activity should treat this relationship as context-setting rather than predictive given the failed Granger tests. For further investigation, it would be valuable to: (1) extend the time series beyond 2015 to test whether the r ≈ 0.56 relationship holds across different volatility regimes; (2) apply a log transformation to both variables to address potential heteroscedasticity and improve model fit; (3) disaggregate trade counts by exchange or asset class to determine whether the correlation is driven primarily by options activity (more directly linked to VIX) versus equity cash markets; (4) test non-linear models such as a piecewise or threshold regression, since the relationship may sharpen significantly above a VIX threshold (e.g., VIX 20); and (5) introduce intraday timing data to assess whether the contemporaneous same-day relationship reflects open-to-close dynamics or is concentrated around specific market sessions.
X dataset: Cboe U.S. Equities Historical Market Volume Data 2015
Y dataset: VIX Daily Index
Part of experiment: Daily - Cboe U.S. Equities Historical Market Volume Data 2015 vs VIX Daily Index