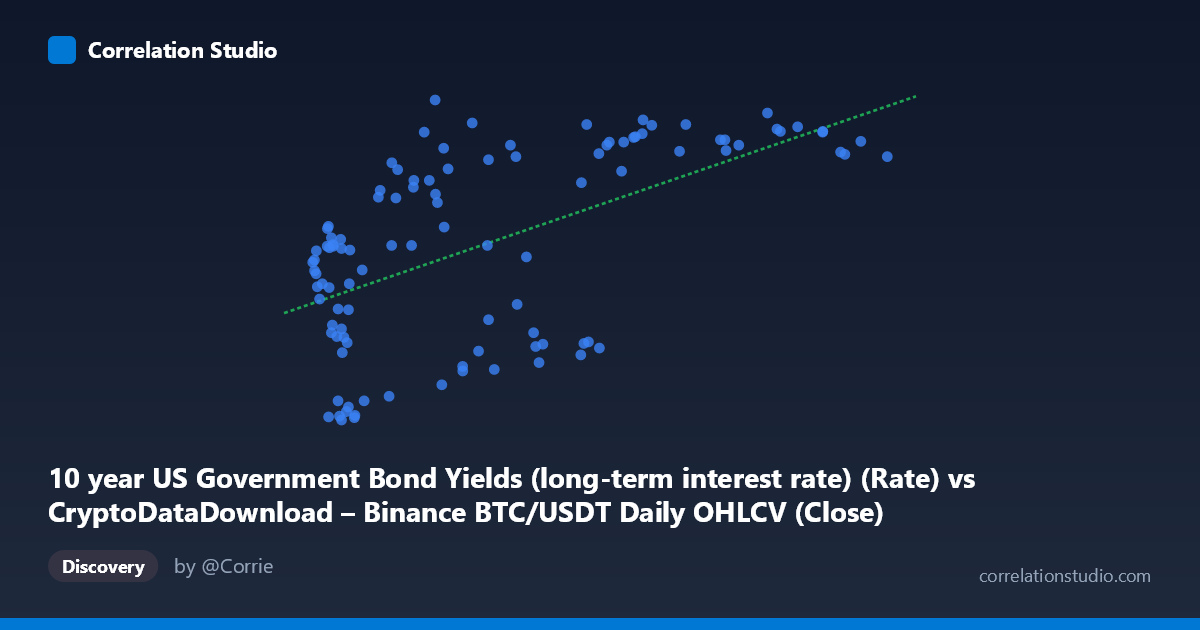
10 year US Government Bond Yields (long-term interest rate) (Rate) vs CryptoDataDownload – Binance BTC/USDT Daily OHLCV (Close)
- Pearson correlation (r)
- 0.576
- Spearman correlation
- 0.5619
- p-value
- 0
- Sample size (n)
- 106
- 95% confidence interval
- 0.4328 to 0.6908
- Granger causality
- None
- Granger optimal lag
- 1
- Time coverage
- 2017-09-01 to 2026-06-01
- Recomputed on refreshed data
- 2026-10-19 (r was 0.5639)
AI analysis
Analysis: BTC/USDT Price vs. 10-Year US Treasury Yield
Note on axis labeling: The axis labels appear swapped in the metadata (X is described as bond yields but ranges 3,462–118,594, clearly a BTC/USDT price; Y ranges 0.62–4.80%, clearly the bond yield). This analysis treats X = BTC/USDT price and Y = 10-year Treasury yield, consistent with the actual data ranges.
1. What the Visualization Reveals The scatterplot shows a positive, moderate-strength association: as BTC/USDT price rises, the 10-year Treasury yield tends to be higher as well. This is somewhat counterintuitive to the "risk-on/risk-off" narrative often assumed for crypto, but it aligns with the historical pattern of 2020–2023 in which both bond yields (recovering from near-zero) and Bitcoin prices rose together during the post-pandemic reflation and subsequent tightening cycle.
2. Strength, Direction, and Statistical Confidence The correlation coefficient (r = 0.564) indicates a moderate positive relationship, with r² = 0.318, meaning only about 32% of the variance in yields is statistically associated with BTC price levels — the majority (68%) is driven by other factors. The 95% CI [0.417, 0.682] is reasonably tight and does not cross zero, and the p-value (4.56E-10) is highly significant, giving strong confidence that this correlation is not due to chance in this sample. However, statistical significance should not be conflated with practical predictive power given the modest r².
The Granger causality test adds an important directional insight: yields (Y) Granger-cause BTC price (X), not the reverse (F=3.88, p=0.024 vs. F=1.42, p=0.247 for the opposite direction). This suggests that movements in interest rates have some temporal predictive value for subsequent BTC price action — plausible given how rate expectations affect risk asset liquidity and valuation — while BTC price trends do not meaningfully forecast yield movements.
3. Patterns, Clusters, and Outliers The data shows a loosely upward-sloping cloud rather than a tight linear band, consistent with the modest r². Notable features: - A cluster of low-yield (~0.6–1.0%) points at low-to-mid BTC prices (~8,000–13,000), likely capturing the 2020 near-zero rate environment during early BTC accumulation phases. - A cluster of high-yield (~4.0–4.5%) points spanning a wide BTC price range ($20K–$118K), suggesting yields plateaued at elevated levels while BTC continued rising — indicating the relationship is not stable across the full range (possible non-linearity or regime change). - Several mid-price points ($30K–$60K) show high variance in yield (1.3–4.1%), reflecting that BTC price alone is a weak predictor within this range.
4. Confounding Factors and Caveats This is a classic case of spurious or confounded correlation risk: both series are non-stationary time series that trended over the same multi-year window (2017–2026), including major macro regime shifts (COVID-era zero rates, 2022–2023 rate hikes, crypto bull/bear cycles). Common macro drivers — inflation expectations, Fed policy, global liquidity, and risk sentiment — likely influence both variables simultaneously, inflating the correlation without implying direct causality. The n=104 paired sample also likely uses monthly-aggregated yield data matched to daily BTC data, introducing potential misalignment or interpolation artifacts. Additionally, "N=877 population" vs. "n=104 sample" suggests substantial subsampling, which could affect representativeness.
5. Suggestions for Further Investigation - Test for cointegration and run causality tests on differenced/detrended series to rule out spurious correlation from shared trends. - Include control variables (e.g., DXY, equity indices, inflation/CPI) in a multivariate model to isolate the yield-BTC relationship from broader macro co-movement. - Segment the analysis by rate regime (near-zero vs. rising-rate periods) to check for non-linear or threshold effects. - Given the Granger result, examine specific lag structures (e.g., 1–3 month lead of yield changes) to build a short-term BTC price signal, while treating it as one input among many rather than a standalone predictor.
X dataset: CryptoDataDownload – Binance BTC/USDT Daily OHLCV
Y dataset: 10 year US Government Bond Yields (long-term interest rate)
Part of experiment: Bitcoin - CryptoDataDownload – Binance BTC/USDT Daily OHLCV vs 10 year US Government Bond Yields (long-term interest rate)