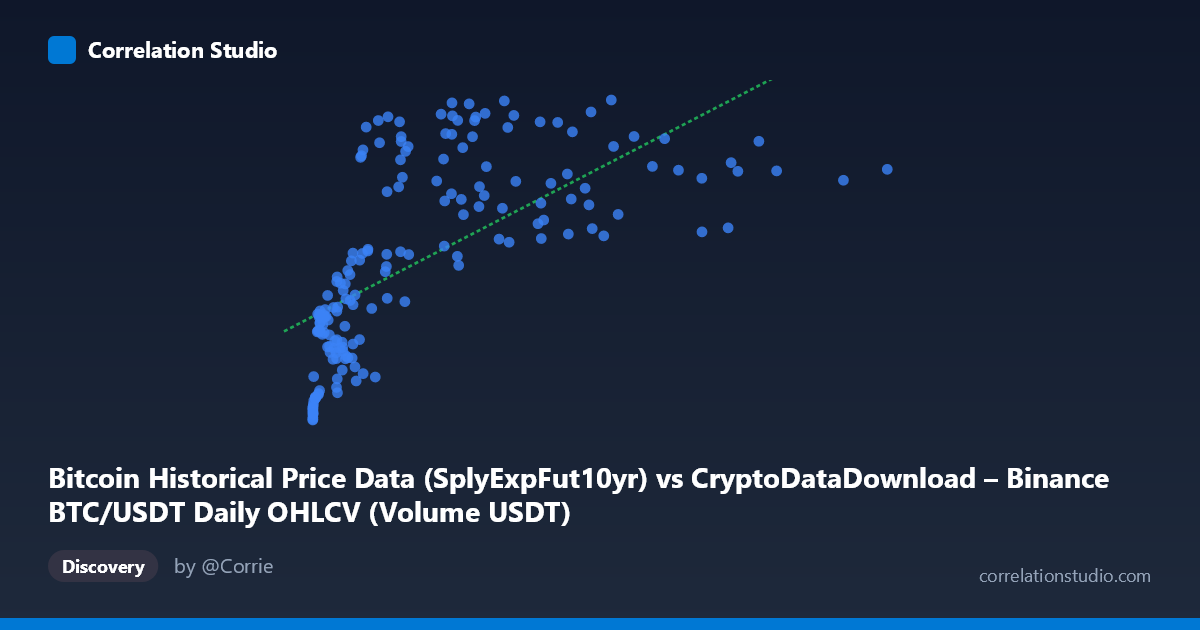
Bitcoin Historical Price Data (SplyExpFut10yr) vs CryptoDataDownload – Binance BTC/USDT Daily OHLCV (Volume USDT)
- Pearson correlation (r)
- 0.6588
- Spearman correlation
- 0.8149
- p-value
- 0
- Sample size (n)
- 180
- 95% confidence interval
- 0.5672 to 0.7343
- Granger causality
- None
- Granger optimal lag
- 10
AI analysis
Analysis: SplyExpFut10yr vs. Volume USDT
1. Overview of the Relationship
The scatterplot shows a positive but non-linear association between the two variables. X ("SplyExpFut10yr") spans an enormous range (~1.3M to ~6.27B), while Y (Volume USDT) is tightly clustered between ~20.2M and ~20.8M — a coefficient of variation of roughly 0.9% versus X's ~114%. This asymmetry is the dominant visual feature: Y rises steeply at low X values and then flattens into a plateau/saturation curve as X grows into the billions, consistent with a logarithmic rather than linear relationship (e.g., Y ≈ a·ln(X) + b).
2. Strength, Direction, and Statistical Confidence
The Pearson correlation (r = 0.659) indicates a moderate-to-strong positive linear relationship, with r² = 0.434 meaning the linear model explains only 43% of the variance in Y — leaving over half unexplained by a straight-line fit. The 95% CI [0.567, 0.734] is reasonably tight and excludes zero, and the p-value (~0) confirms the correlation is highly statistically significant and not a product of chance, even though this is a sub-sample (n=180) of a larger population (N=3,212). However, the note that Spearman ρ exceeds Pearson r is a strong signal that a monotonic, non-linear model (log/power) would fit substantially better — the linear r² likely understates the true strength of the relationship. Critically, Granger causality tests show no significant predictive direction in either direction (X→Y: p=0.969; Y→X: p=0.723) at up to 10 lags. This means despite the contemporaneous correlation, neither series is a useful time-lagged predictor of the other — the relationship is likely driven by both variables trending upward together over the same calendar period rather than one causing/leading the other.
3. Patterns, Clusters, and Outliers
Most points cluster at low-to-moderate X values (under ~1B) with Y already near its ceiling (~20.6–20.8M), indicating Y saturates early. A sparse tail of high-X points (2B–6.3B) shows Y oscillating in the same narrow band without a clear continued increase — evidence of a plateau rather than continued linear growth. A few low-X, low-Y points (e.g., X≈1.9M, Y≈20.21M; X≈4.6M, Y≈20.23M) anchor the bottom-left corner and pull the linear fit's slope down, exaggerating the impression of a strong linear trend at the low end. No true outliers break the monotonic pattern, but the compressed Y range suggests high sensitivity to small absolute differences in volume.
4. Confounders and Caveats
Both variables appear to be time-indexed BTC market metrics (supply-based futures proxy vs. trading volume), so their shared upward drift over 2017–2026 is very plausibly a common trend/confound (overall crypto market growth, adoption, exchange volume inflation) rather than a direct causal link. The extreme skew in X (mean 1.16B vs. median likely far lower, given the range) means the linear regression is disproportionately influenced by a handful of large-X points. Additionally, comparing a "supply" metric (SplyExpFut10yr) to "trading volume" mixes conceptually different market dimensions — any correlation may be an artifact of both being monotonically related to time/price rather than a direct economic relationship.
5. Recommendations
- Refit using a log or power transform on X (or log-log on both) to capture the apparent saturation curve; report r² for the non-linear model, which should exceed 0.434. - Because Granger tests reject temporal causality, avoid using either series to forecast the other in a lagged time-series model; instead, treat any relationship as concurrent/structural. - Detrend both series (e.g., first-difference or remove long-term trend) and re-test correlation/Granger causality on residuals to check if the relationship is merely due to shared time trends. - Investigate whether a third variable (BTC price, market cap, or time itself) is the true common driver, using partial correlation controlling for time or price.
X dataset: CryptoDataDownload – Binance BTC/USDT Daily OHLCV
Y dataset: Bitcoin Historical Price Data
Part of experiment: Bitcoin - CryptoDataDownload – Binance BTC/USDT Daily OHLCV vs Bitcoin Historical Price Data