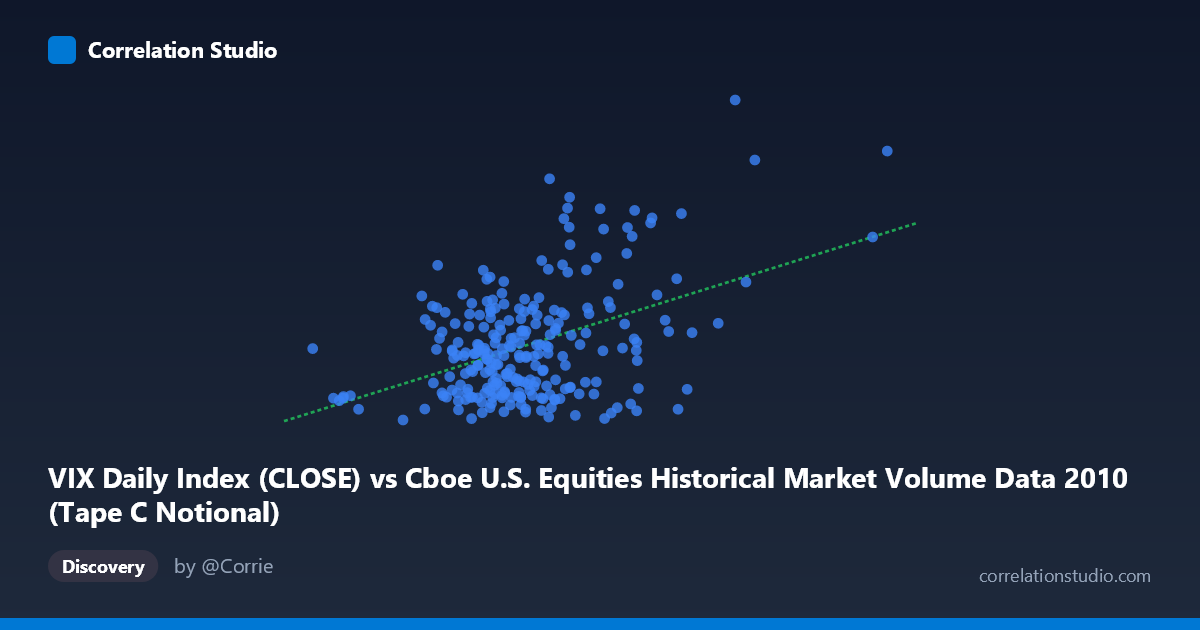
VIX Daily Index (CLOSE) vs Cboe U.S. Equities Historical Market Volume Data 2010 (Tape C Notional)
- Pearson correlation (r)
- 0.4363
- Spearman correlation
- 0.2604
- p-value
- 0
- Sample size (n)
- 252
- 95% confidence interval
- 0.3306 to 0.5313
- Granger causality
- Y → X
- Granger optimal lag
- 1
AI analysis
Scatterplot Analysis: VIX vs. Tape C Notional Volume (2010)
Overall Relationship
The scatterplot reveals a moderate positive relationship between the VIX Daily Close Index and Tape C Notional trading volume across U.S. equity exchanges in 2010. As VIX levels rise — indicating higher market volatility and fear — Tape C notional volume tends to increase as well. This aligns intuitively with market microstructure theory: periods of elevated uncertainty typically drive heightened trading activity as investors rebalance, hedge, or liquidate positions. The linear regression equation (y = 2.35×10⁻⁹x + 13.32) confirms a positive slope, though the modest intercept suggests a baseline level of trading activity exists even when volatility is subdued.
Correlation Strength and Statistical Significance
The Pearson correlation of r = 0.4363 indicates a moderate positive association, but the more telling statistic is r² = 0.1904 — meaning VIX levels explain only about 19% of the variance in Tape C notional volume. The remaining ~81% of variability is driven by other factors entirely. The 95% confidence interval [0.3306, 0.5313] is meaningfully above zero and does not straddle it, reinforcing that the relationship is real rather than artifactual. The p-value of 3.89×10⁻¹³ confirms overwhelming statistical significance given n = 252 paired observations drawn from a population of N = 3,302. Critically, the Granger causality results reveal a unidirectional temporal relationship: Y Granger-causes X (F = 7.10, p = 0.0082), meaning past VIX values have statistically significant predictive power over future Tape C notional volume at a 1-period lag — but not vice versa (F = 1.90, p = 0.169). This suggests that rising volatility precedes increases in trading volume rather than the other way around, which has meaningful implications for short-term volume forecasting.
Notable Patterns, Clusters, and Outliers
The sample points reveal several structural features worth highlighting. The bulk of observations cluster in the VIX range of roughly 2.8B–5.2B on the x-axis, with Y values concentrated between 15 and 27, forming a dense core with relatively modest volume even at moderate volatility. However, a visually distinct upper-right cluster emerges at high VIX values (above ~6.0B), where notional volume jumps dramatically — points like (8.48B, 40.95), (6.81B, 40.10), and (5.51B, 34.61) appear as clear outliers from the main cloud. Conversely, high-VIX observations paired with low volume (e.g., (5.84B, 16.47)) suggest the relationship is heteroscedastic — variance in Y widens considerably as X increases. There is also a noticeable group of low-volume, low-VIX observations clustering near the lower-left, suggesting prolonged calm periods in 2010 with subdued activity.
Confounding Factors and Caveats
Several important caveats temper interpretation. First, Tape C specifically captures NYSE Arca-listed securities, so this notional measure is a partial slice of total market activity; systemic volume shifts may reflect exchange routing decisions or competitive dynamics rather than pure volatility response. Second, the axes appear to be swapped from what might be expected — VIX is on the x-axis and notional volume on the y-axis, yet Granger causality runs Y→X, meaning VIX is actually the outcome being predicted temporally. This unusual framing warrants careful attention when drawing directional conclusions. Third, calendar effects (quarter-end rebalancing, option expiration cycles, low-liquidity holiday periods) could jointly inflate both VIX and volume, creating spurious correlation. Finally, 2010 was a structurally unique year — the Flash Crash of May 6, 2010 likely accounts for several extreme outliers and could disproportionately influence both the correlation coefficient and the Granger test results.
Actionable Insights and Further Investigation
For practitioners, the Granger causality finding (VIX Granger-causes volume at lag 1) suggests that day-ahead VIX readings could serve as a useful signal for anticipating elevated Tape C notional volume, supporting liquidity planning and execution strategy. However, given that only 19% of variance is explained, VIX alone is an insufficient predictor and should be combined with other features. Recommended next steps include: (1) testing non-linear models (e.g., logarithmic or piecewise regression) given the apparent heteroscedasticity and outlier clustering at high VIX; (2) isolating the Flash Crash period to assess whether the correlation holds in "normal" vs. "stress" regimes separately; (3) incorporating additional volume tapes (A and B) to examine whether the VIX-volume relationship is consistent across exchanges; and (4) extending the Granger analysis to multiple lags to determine whether predictive power persists beyond 1 day.
X dataset: Cboe U.S. Equities Historical Market Volume Data 2010
Y dataset: VIX Daily Index
Part of experiment: Daily - Cboe U.S. Equities Historical Market Volume Data 2010 vs VIX Daily Index