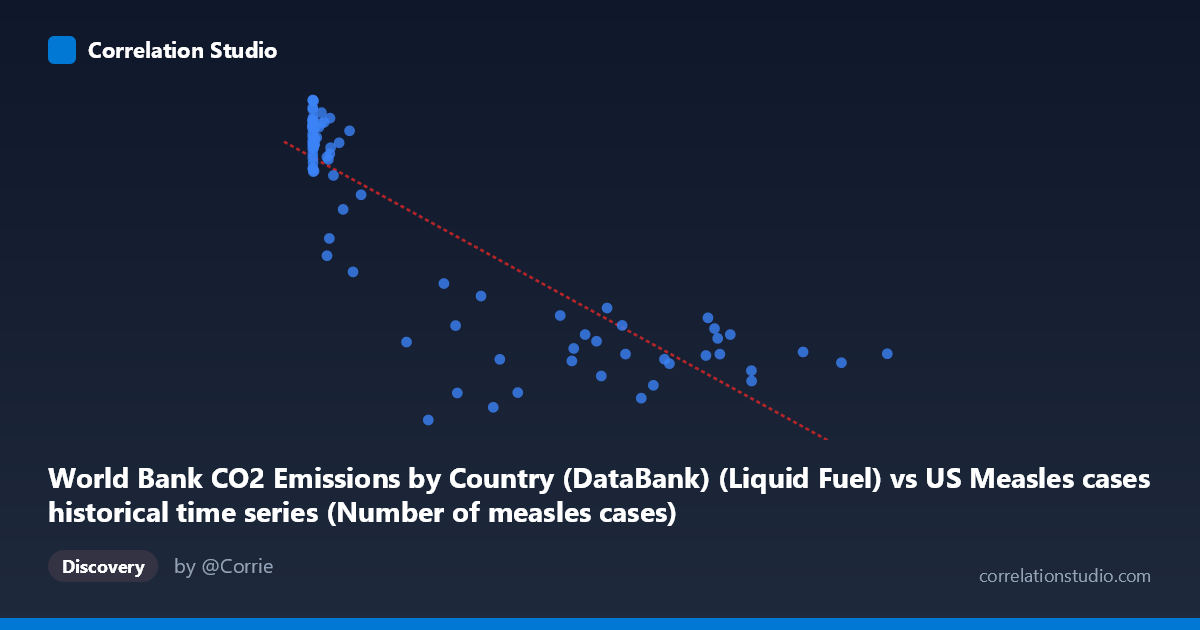
World Bank CO2 Emissions by Country (DataBank) (Liquid Fuel) vs US Measles cases historical time series (Number of measles cases)
- Pearson correlation (r)
- -0.8519
- Spearman correlation
- -0.8013
- p-value
- 0
- Sample size (n)
- 87
- 95% confidence interval
- -0.9009 to -0.7815
- Granger causality
- None
- Granger optimal lag
- 10
- Time coverage
- 1919-01-01 to 2020-01-01
- Recomputed on refreshed data
- 2026-10-18 (r was -0.8519)
AI analysis
Analysis: US Measles Cases vs. CO2 Liquid Fuel Emissions (1919–2020)
1. Overall Relationship Revealed
The scatterplot reveals a striking negative relationship between liquid fuel CO2 emissions and US measles case counts across the 20th and early 21st centuries. As emissions rise — reflecting industrialization and economic development — measles cases fall dramatically. The linear regression equation (y = −0.0134x + 11,421.5) captures a broad downward sweep, but the visual pattern is distinctly non-linear: measles cases cluster at high values (~11,000–13,600) when emissions are very low (X < ~50,000), then drop sharply and level off at lower case counts as emissions increase. This L-shaped or hyperbolic curve suggests the relationship is more complex than a simple linear model can fully capture.
2. Correlation Strength, Direction, and Temporal Causality
The correlation is strong and negative (r = −0.8519), with the linear model explaining 72.6% of the variance in measles cases (R² = 0.7257). The 95% confidence interval [−0.9009, −0.7815] is narrow and entirely negative, and the p-value is effectively zero, confirming this is a highly statistically significant association rather than a chance finding. However, the Granger causality tests are unambiguous in both directions: X→Y (F = 0.558, p = 0.841) and Y→X (F = 0.458, p = 0.910) both fail to reach significance at any conventional threshold. This means that, even accounting for up to 10 temporal lags, neither variable predictively leads the other in time. The correlation, while numerically strong, carries no detectable temporal predictive structure — a critical caveat for causal interpretation.
3. Notable Patterns, Clusters, and Outliers
Several distinct features stand out in the data:
- High-Y, low-X cluster: A dense cluster of points with X < ~50,000 and Y ranging from ~10,000–13,600 represents the pre-vaccine era (pre-1963), when measles was endemic and fossil fuel use was still modest. The point at (13.00, 12,317) and (120.00, 13,601.94) illustrate how extreme this era was for measles burden. - The dramatic drop zone: Points in the X range of ~100,000–300,000 show a sharp, steep decline in Y, corresponding roughly to the vaccine introduction period (mid-1960s onward). - Low-Y, high-X plateau: Points with X ~400,000 scatter across a relatively flat band of Y values (~1,500–6,000), with notable spread. The outlier at (179,829, 1,457.67) is the lowest measles value and may reflect a particularly effective control year. - High-emission outliers: Points like (894,134, 3,972) and (763,094, 4,040) show that even at peak emissions, measles cases remain suppressed but nonzero — consistent with occasional outbreaks in the modern era.
4. Confounding Factors and Critical Caveats
This correlation is a near-textbook example of confounded time-series association. Both variables are driven overwhelmingly by a shared hidden variable: time and the broad arc of 20th-century development. Specifically:
- Vaccine introduction (1963) is the dominant driver of measles decline, not emissions. The Measles-Mumps-Rubella (MMR) vaccine program caused a near-vertical collapse in case counts, which happens to coincide temporally with rising industrial emissions. - Population growth, urbanization, and healthcare infrastructure all advanced simultaneously, confounding any direct link. - The dataset label mismatch noted in the metadata (CO2 emissions data labeled under the measles dataset and vice versa) warrants verification — the axis assignments should be confirmed before drawing any operational conclusions. - The non-linearity means the linear R² of 0.7257 is partly an artifact; a log-transformed or piecewise model would better characterize the true shape. - The Granger causality null result is particularly telling: even with 10 lags (~10 years of lead-lag structure), emissions tell us nothing about future measles trends and vice versa, reinforcing that the association is spurious in a causal sense.
5. Actionable Insights and Further Investigation
Despite the lack of causal meaning, this analysis offers useful methodological lessons and practical leads:
- Control for time explicitly: Re-run the analysis using year as a covariate or by taking first-differences of both series; this will likely reduce or eliminate the apparent correlation, revealing whether any residual relationship exists. - Introduce vaccination rates as a mediating variable — a partial correlation or structural equation model controlling for vaccine coverage would clarify how much of the measles decline is explained by immunization versus other development factors. - Apply a log or power transformation to the X axis (emissions), given the extreme right skew (mean ~188K, max ~894K), to assess whether the relationship linearizes and whether R² improves or collapses. - Segment the time series into pre-vaccine (1919–1963) and post-vaccine (1964–2020) eras separately; the correlation within each era may be near zero, which would confirm that the aggregate correlation is entirely an artifact of the structural break caused by vaccination. - Cross-country comparison using the World Bank's multi-country CO2 dataset could test whether nations with similar emissions trajectories but different vaccination timelines show divergent measles trends — a powerful natural experiment for disentangling development effects from vaccine effects.
--- Bottom line: The strong negative correlation (r = −0.85) between liquid fuel CO2 emissions and US measles cases is almost certainly spurious, driven by shared temporal trends across the 20th century rather than any meaningful causal pathway. The complete absence of Granger causality in either direction, combined with the obvious biological mechanism of vaccine introduction, makes this a cautionary example of why correlation — even statistically robust correlation — demands rigorous causal scrutiny before interpretation.
X dataset: US Measles cases historical time series
Y dataset: World Bank CO2 Emissions by Country (DataBank)
Part of experiment: Yearly - US Measles cases historical time series vs World Bank CO2 Emissions by Country (DataBank)