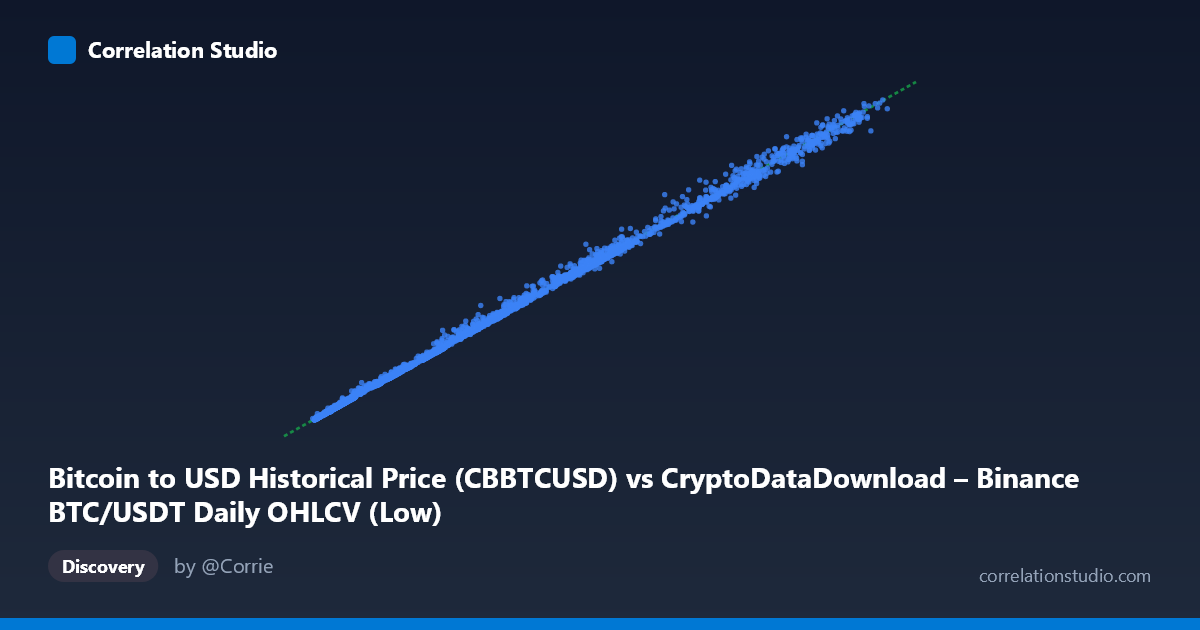
Bitcoin to USD Historical Price (CBBTCUSD) vs CryptoDataDownload – Binance BTC/USDT Daily OHLCV (Low)
- Pearson correlation (r)
- 0.9993
- Spearman correlation
- 0.9994
- p-value
- 0
- Sample size (n)
- 3211
- 95% confidence interval
- 0.9992 to 0.9993
- Granger causality
- None
- Granger optimal lag
- 10
- Time coverage
- 2017-08-17 to 2026-06-25
- Recomputed on refreshed data
- 2026-10-24 (r was 0.9993)
AI analysis
Analysis: Bitcoin Price Correlation (Binance vs. Coinbase-derived Series)
1. What the Visualization Reveals
The scatterplot shows an almost perfectly linear relationship between two BTC/USD price series — one from Binance (CBBTCUSD close/composite) and one from a Coinbase-sourced dataset (Binance Low column, per the metadata). Points hug a straight line running from the low thousands up to ~$120,000, spanning what appears to be nearly the full historical range of Bitcoin's price from 2017 through mid-2026. The regression line (y = 1.017x + 265.19) has a slope very close to 1 and a near-zero intercept relative to the price scale, indicating the two series track each other almost identically in absolute dollar terms across all price regimes — from BTC trading near $3,000 to over $120,000.
2. Strength, Direction, and Statistical Confidence
The correlation is essentially as strong as empirical financial data gets: r = 0.9993, r² = 0.9985, meaning 99.85% of the variance in one series is explained by the other. The 95% CI [0.9992, 0.9993] is extremely tight given the large sample (n=3,211), and the p-value is reported as 0 (vanishingly small), confirming this relationship is not due to chance. Practically, this means the two series are near-duplicates of the same underlying asset price, not independent variables with a "real-world" causal relationship to investigate — this is closer to a data-consistency check than a discovery of an economic relationship. The Granger causality results reinforce this: neither direction is significant (p = 0.144 and p = 0.153 at 10 lags), meaning neither series leads or predicts the other over time. This is expected and important — it confirms these are contemporaneous, synchronized price feeds (likely arbitraged instantly across exchanges) rather than one market driving the other with a lag.
3. Patterns, Clusters, and Outliers
The data shows no clear clustering by regime — points span continuously from ~$3,000 to ~$123,000, suggesting the sample captures Bitcoin's full multi-year bull/bear cycle history rather than isolated snapshots. A few points show modest deviation from the 1:1 line, notably in the $55,000–$60,000 range (e.g., 56850.00 vs. 61682.48, and 56777.77 vs. 59200.00), where Y values run noticeably higher than X — a gap of roughly 5,000–8%, larger than elsewhere in the dataset. This suggests a period of elevated tracking error or divergence between the Binance and Coinbase-sourced feeds, possibly during a volatile period (flash crash, exchange-specific liquidity event, or funding/basis divergence). Otherwise, the relationship appears log-linear/proportional across scales, with no visible heteroscedasticity or curvature — consistent with two feeds of the same asset rather than two economically distinct variables.
4. Confounders and Caveats
The central caveat is that this is very likely not two independent variables but two measurements of the same underlying phenomenon (BTC/USD price) sourced from different exchanges/datasets. High correlation here reflects market efficiency and arbitrage (price convergence across venues) rather than a meaningful causal or predictive relationship. Standard confounds to flag: (a) both series share the same macro drivers (BTC adoption cycles, macro liquidity, regulatory news), so co-movement is mechanically guaranteed; (b) the "Low" column in the Y source vs. a closing/composite price in X means minor mismatches (like the $55–60K divergence) likely reflect intraday volatility, exchange-specific liquidity gaps, or timestamp/timezone misalignment between Binance and Coinbase data pulls, not a genuine economic signal; (c) autocorrelation within each price series (both are trending, non-stationary time series) inflates the correlation coefficient beyond what's meaningful for causal inference — this is a classic case where r² on price levels is misleading without differencing or returns-based analysis.
5. Suggestions for Further Investigation
Given the near-identity relationship, further analysis should shift focus: (1) examine the residuals directly (Y − predicted Y) as a time series to isolate periods of exchange divergence, such as the $55–60K anomaly noted above — this could reveal specific dates of liquidity stress or data quality issues; (2) re-run correlation and Granger tests on returns (log differences) rather than price levels, which would better test whether one exchange's price movements lead the other on a minute/day basis, free from the non-stationarity that inflates the level-based r²; (3) verify timestamp alignment and timezone handling between the two data sources, since Binance and Coinbase datasets may close daily bars at different UTC boundaries; and (4) treat this pairing primarily as a data validation/reconciliation exercise — confirming feed consistency — rather than a hypothesis-driven correlation study between distinct market variables.
X dataset: CryptoDataDownload – Binance BTC/USDT Daily OHLCV
Y dataset: Bitcoin to USD Historical Price
Part of experiment: Bitcoin - CryptoDataDownload – Binance BTC/USDT Daily OHLCV vs Bitcoin to USD Historical Price