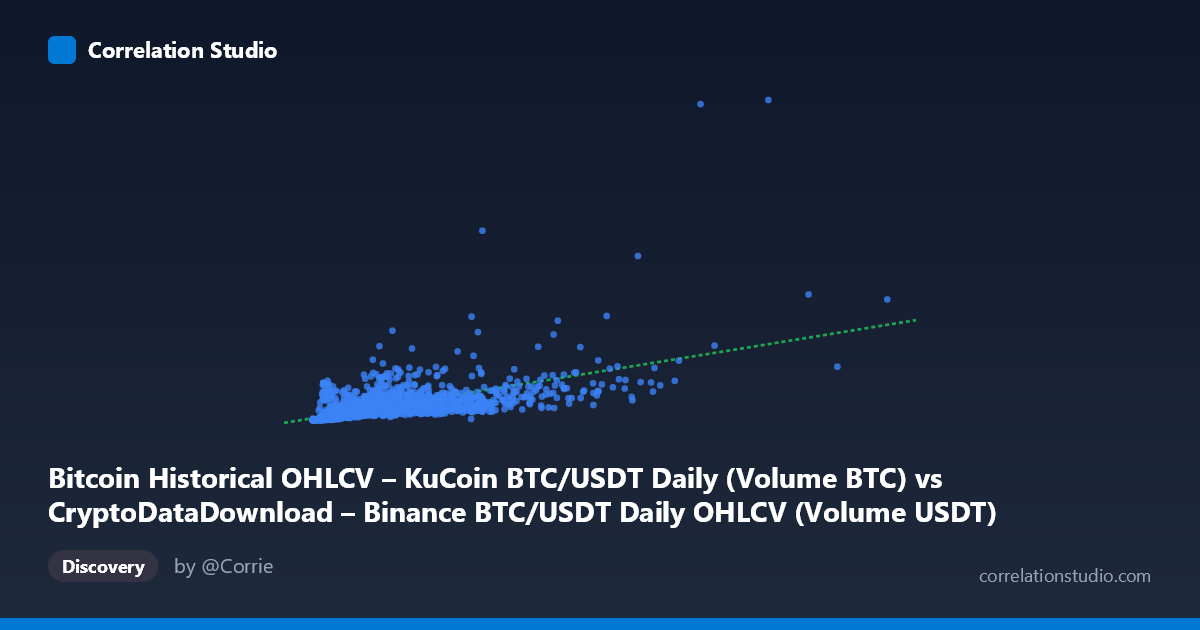
Bitcoin Historical OHLCV – KuCoin BTC/USDT Daily (Volume BTC) vs CryptoDataDownload – Binance BTC/USDT Daily OHLCV (Volume USDT)
- Pearson correlation (r)
- 0.6418
- Spearman correlation
- 0.863
- p-value
- 0
- Sample size (n)
- 1861
- 95% confidence interval
- 0.6143 to 0.6678
- Granger causality
- None
- Granger optimal lag
- 10
AI analysis
Analysis: Binance BTC/USDT Volume (BTC) vs. KuCoin BTC/USDT Volume (USDT)
1. What the Visualization Reveals
This scatterplot compares daily trading volume on two different exchanges (Binance and KuCoin) for the same underlying asset pair (BTC/USDT), measured in different units (BTC on the X-axis, USDT on the Y-axis). The moderate-to-strong positive correlation (r = 0.64) indicates that on days when Binance sees heavy BTC-denominated trading activity, KuCoin tends to also see elevated USDT-denominated volume. This is consistent with the intuition that crypto markets move in tandem — high-volatility or high-interest periods (news events, price surges/crashes) tend to drive volume across exchanges simultaneously, since traders and arbitrageurs operate across platforms.
2. Strength, Direction, and Statistical Confidence
An r of 0.64 (r² = 0.412) means only about 41% of the variance in KuCoin volume is explained by Binance volume — a meaningful but far from complete relationship. The 95% CI [0.614, 0.668] is tight given the large sample (n = 1,861 daily observations), and the p-value of ~0 confirms this correlation is not due to chance. However, statistical significance here reflects sample size more than practical predictive strength — 59% of the variance remains unexplained. The Granger causality tests are notable: neither direction (X→Y or Y→X) shows significant predictive power at a 10-period lag (p = 0.28 and p = 0.83, respectively). This suggests the correlation is contemporaneous rather than causal/predictive — both series likely respond simultaneously to a shared external driver (e.g., overall market volatility or price action) rather than one exchange's volume leading the other's.
3. Notable Patterns and Non-linear Features
The regression line (y = 2.589e-6·x + 721.9) is a poor visual fit at the extremes: low-volume days cluster tightly near the origin, while a handful of high-volume days (X 5 billion) show substantial scatter, including one apparent outlier around (6.3B, 40,616) that sits well above the trend. The note that Spearman's ρ exceeds Pearson's r is important — it implies the relationship is monotonic but curved, likely better modeled as a power-law or log-log relationship. This makes sense given both volume series likely follow heavy-tailed, log-normal-like distributions typical of financial volume data (evidenced by the huge stdev-to-mean ratios on both axes).
4. Confounding Factors and Caveats
Several caveats apply. First, both variables are proxies for the same latent factor — "market-wide trading intensity" — so the correlation may partly reflect a shared confound (BTC price volatility, major news events, macro conditions) rather than any direct link between the exchanges. Second, the mismatched units (BTC vs. USDT) mean the relationship is also mechanically influenced by BTC's price over time — as BTC price rose, a fixed BTC volume corresponds to more USDT, inflating correlation independent of "true" trading behavior. Third, the multi-year time span (2017–2022) includes structurally different market regimes (2017 bull run, 2018–19 bear market, 2020–21 bull run, 2022 crash), and pooling these periods can create spurious aggregate correlation (Simpson's-paradox-like effects) that wouldn't hold within any single regime.
5. Suggestions for Further Investigation
To disentangle these effects: (1) convert Binance volume to USDT-equivalent (multiply by daily price) to remove the unit-driven confound and re-test correlation; (2) apply a log-log transform to both variables given the skewed distributions and Spearman/Pearson discrepancy, then refit with a power-law model; (3) segment the analysis by market regime/year to check correlation stability over time; (4) since Granger causality found no lead-lag relationship, consider testing for cointegration or examining same-day correlation of returns/changes in volume rather than levels, which may better reveal shared shock dynamics; (5) investigate the high-volume outlier(s) to determine if they correspond to specific market events (e.g., flash crashes, exchange outages) that may warrant exclusion or separate treatment.
X dataset: CryptoDataDownload – Binance BTC/USDT Daily OHLCV
Y dataset: Bitcoin Historical OHLCV – KuCoin BTC/USDT Daily
Part of experiment: Bitcoin - CryptoDataDownload – Binance BTC/USDT Daily OHLCV vs Bitcoin Historical OHLCV – KuCoin BTC/USDT Daily