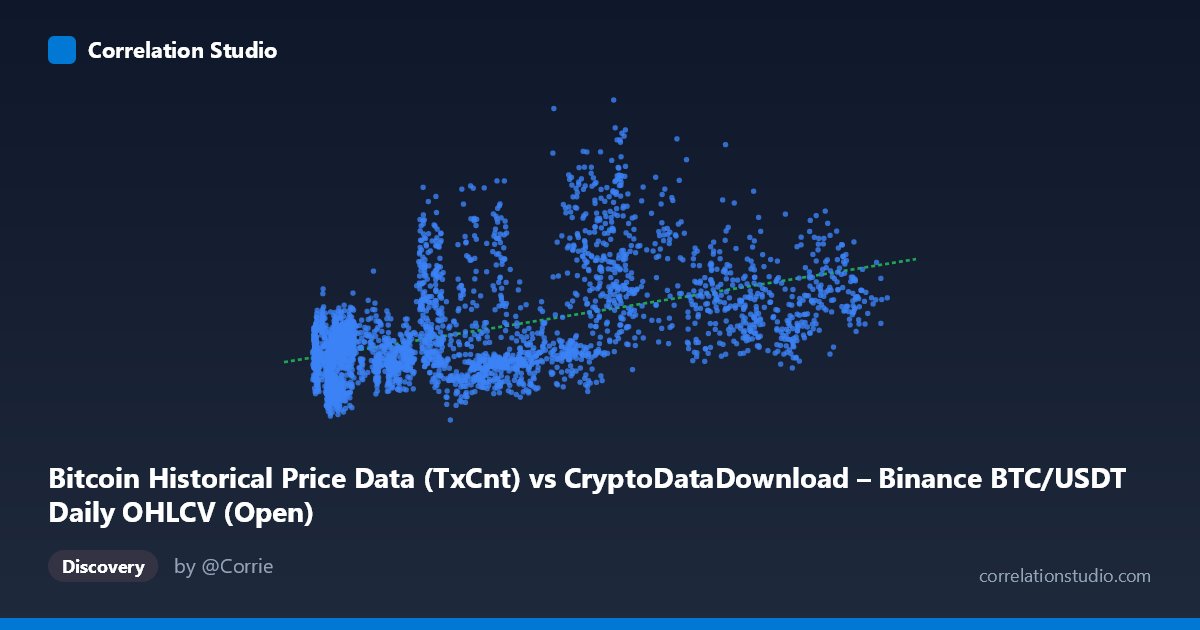
Bitcoin Historical Price Data (TxCnt) vs CryptoDataDownload – Binance BTC/USDT Daily OHLCV (Open)
- Pearson correlation (r)
- 0.5019
- Spearman correlation
- 0.5044
- p-value
- 0
- Sample size (n)
- 3191
- 95% confidence interval
- 0.4754 to 0.5274
- Granger causality
- None
- Granger optimal lag
- 10
AI analysis
Analysis: Bitcoin Transaction Count vs. Opening Price
1. Overview of the Relationship
The scatterplot shows a positive but noisy relationship between Bitcoin's transaction count (X) and its opening price (Y). Points are widely scattered rather than tightly clustered around the regression line (y = 1.938x + 274,937), indicating that while higher transaction counts tend to co-occur with higher prices, the relationship is loose and highly variable. At any given X value, Y spans a broad range — for example, transaction counts near 10,000 correspond to prices anywhere from ~130,000 to ~400,000, illustrating substantial dispersion around the trend.
2. Strength, Direction, and Statistical Confidence
The correlation coefficient (r = 0.502) indicates a moderate positive relationship, and r² = 0.252 means only about 25% of the variance in price is explained by transaction count — leaving 75% attributable to other factors. The 95% CI [0.475, 0.529] is fairly narrow given the large sample (n = 3,191), and the p-value ≈ 0 confirms this correlation is highly statistically significant and not due to chance. However, statistical significance here reflects sample size more than practical predictive strength — r² of 0.25 is a weak-to-moderate explanatory power in practical terms.
Critically, the Granger causality tests show no significant predictive direction in either direction (X→Y: p = 0.62; Y→X: p = 0.89) at the optimal lag of 10 periods. This means transaction count does not meaningfully help forecast future price movements, nor does price help forecast future transaction counts. The correlation appears to be more of a contemporaneous co-movement (both variables likely responding to a shared underlying driver, such as overall market cycles or adoption trends) rather than one variable causing or leading the other.
3. Notable Patterns and Outliers
The data reveals a fan-shaped/heteroscedastic pattern: variance in Y increases as X increases, particularly beyond ~50,000 transactions, where prices swing from ~200,000 to over 900,000. Several notable outliers exist — points like (42,140, 724,837) and (4,175, 211,916) sit far from the regression line, showing cases of high price at low/moderate transaction counts (or vice versa). This scattering suggests the presence of distinct market regimes (e.g., bull vs. bear cycles) where the same transaction volume corresponds to very different price levels depending on the period.
4. Confounding Factors and Caveats
Several caveats limit causal interpretation: - Time-series non-stationarity: Both variables likely trend over time (covering 2017–2026), so the correlation may partly reflect two independent upward trends rather than genuine interaction. - Omitted variables: Macroeconomic conditions, regulatory news, exchange volume, mining difficulty, and broader crypto market sentiment likely drive both series simultaneously. - Autocorrelation: Daily financial/network data is highly autocorrelated, which can inflate apparent correlation and complicate Granger causality interpretation even at lag 10. - Mixed data granularity: Transaction count (network-level metric) and price (exchange-level metric) may reflect different market mechanisms (on-chain activity vs. speculative trading).
5. Recommendations for Further Investigation
- Detrend or difference the series (e.g., use returns/percentage changes instead of levels) before re-running correlation and Granger tests to control for shared trends and non-stationarity. - Segment by market regime (bull/bear/sideways periods) to check if the relationship strengthens or weakens under different conditions. - Test additional lags beyond 10 periods, and consider non-linear causality tests (e.g., transfer entropy) given the fan-shaped scatter suggesting non-constant variance. - Incorporate additional variables (trading volume, active addresses, macro indicators) to build a multivariate model rather than relying on a single bivariate predictor. - Use price alone with caution as a proxy for network activity — the weak Granger result suggests transaction count is not a reliable leading indicator for trading strategies based on this dataset alone.
X dataset: CryptoDataDownload – Binance BTC/USDT Daily OHLCV
Y dataset: Bitcoin Historical Price Data
Part of experiment: Bitcoin - CryptoDataDownload – Binance BTC/USDT Daily OHLCV vs Bitcoin Historical Price Data