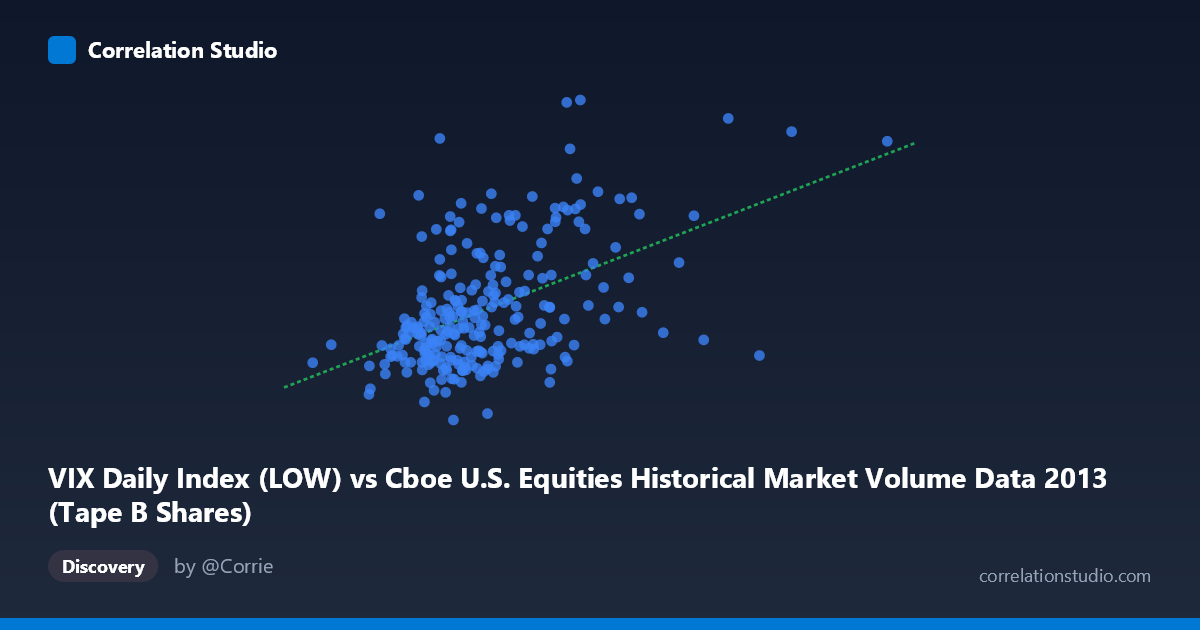
VIX Daily Index (LOW) vs Cboe U.S. Equities Historical Market Volume Data 2013 (Tape B Shares)
- Pearson correlation (r)
- 0.4865
- Spearman correlation
- 0.4185
- p-value
- 0
- Sample size (n)
- 252
- 95% confidence interval
- 0.3861 to 0.5754
- Granger causality
- None
- Granger optimal lag
- 1
AI analysis
Scatterplot Analysis: VIX Tape B Shares vs. VIX Daily Index (Low)
Overall Relationship
The scatterplot reveals a moderate positive relationship between the VIX Daily Index Low values (X-axis) and Tape B Shares trading volume (Y-axis) across 252 trading days in 2013. As the VIX Low increases, Tape B share volume tends to rise as well, consistent with the intuitive notion that elevated market fear or uncertainty (as captured by the VIX) coincides with heightened trading activity. The linear regression equation (y = 4.13E-08x + 10.88) reflects a modest but meaningful slope, suggesting that each unit increase in VIX Low is associated with a small but consistent uptick in Tape B volume.
Correlation Strength and Statistical Significance
The Pearson correlation of r = 0.487 indicates a moderate positive association, but the more telling figure is r² = 0.237 — meaning only about 23.7% of the variance in Tape B Shares is explained by VIX Low levels. The remaining ~76% is driven by factors outside this model. The 95% confidence interval of [0.39, 0.58] is reasonably tight and excludes zero, and the p-value of 2.22E-16 confirms the relationship is highly statistically significant given the population size of 3,780. However, statistical significance here is partly a function of the large N; the practical effect size is modest. Critically, the Granger causality tests are non-significant in both directions (X→Y: F=0.92, p=0.34; Y→X: F=0.70, p=0.40), meaning neither variable reliably predicts the other temporally with a one-period lag. This is an important caveat: the correlation is contemporaneous rather than predictive.
Notable Patterns, Clusters, and Outliers
The sample points reveal a broad, somewhat dispersed cloud with a discernible upward trend, but with considerable scatter — particularly at moderate X values (roughly 55M–80M range) where Y values span from ~12 to ~17, suggesting high conditional variance. Several notable outliers stand out: the point near (89.9M, 19.0) represents an unusually high VIX reading paired with elevated volume, and the cluster around (119.7M, 16.2) and (135.0M, 12.7) suggests that very high X values do not uniformly produce high Y values, hinting at potential non-linearity or regime effects at the extremes. The lower-left cluster (X < 65M, Y ≈ 12–13) reflects calm, low-volatility periods with subdued trading, forming a relatively tight grouping that anchors the regression.
Confounding Factors and Caveats
Several important caveats apply. First, 2013 was a relatively low-volatility year for U.S. equities (post-crisis calm), which compresses the VIX range and may limit generalizability to higher-volatility regimes. Second, Tape B shares specifically represent NYSE American and regional exchange volume, which may respond differently to volatility signals than broad market volume — mixing two distinct measurement domains (fear index vs. exchange-specific volume) introduces conceptual noise. Third, day-of-week effects, earnings seasons, and macroeconomic announcements could simultaneously drive both VIX spikes and volume surges, creating spurious co-movement. Fourth, the absence of Granger causality suggests any observed correlation may reflect common responses to third-party shocks rather than a direct mechanistic link.
Actionable Insights and Further Investigation
Given the moderate but incomplete explanatory power, several follow-up analyses are warranted. Segmenting by market regime (e.g., high vs. low VIX environments, or pre/post Federal Reserve announcements in 2013) could reveal whether the correlation strengthens under specific conditions. Testing non-linear specifications (e.g., quadratic or log-transformed models) may better capture the relationship at VIX extremes. Investigating whether other VIX metrics (closing value, intraday range) produce stronger correlations with Tape B volume could refine the model. Finally, incorporating additional covariates — such as broad market returns (SPX), overall NYSE volume, or macroeconomic surprises — would help isolate whether the VIX-volume relationship is genuine or largely mediated by confounders, and could substantially improve the explained variance beyond the current 23.7%.
X dataset: Cboe U.S. Equities Historical Market Volume Data 2013
Y dataset: VIX Daily Index
Part of experiment: Daily - Cboe U.S. Equities Historical Market Volume Data 2013 vs VIX Daily Index