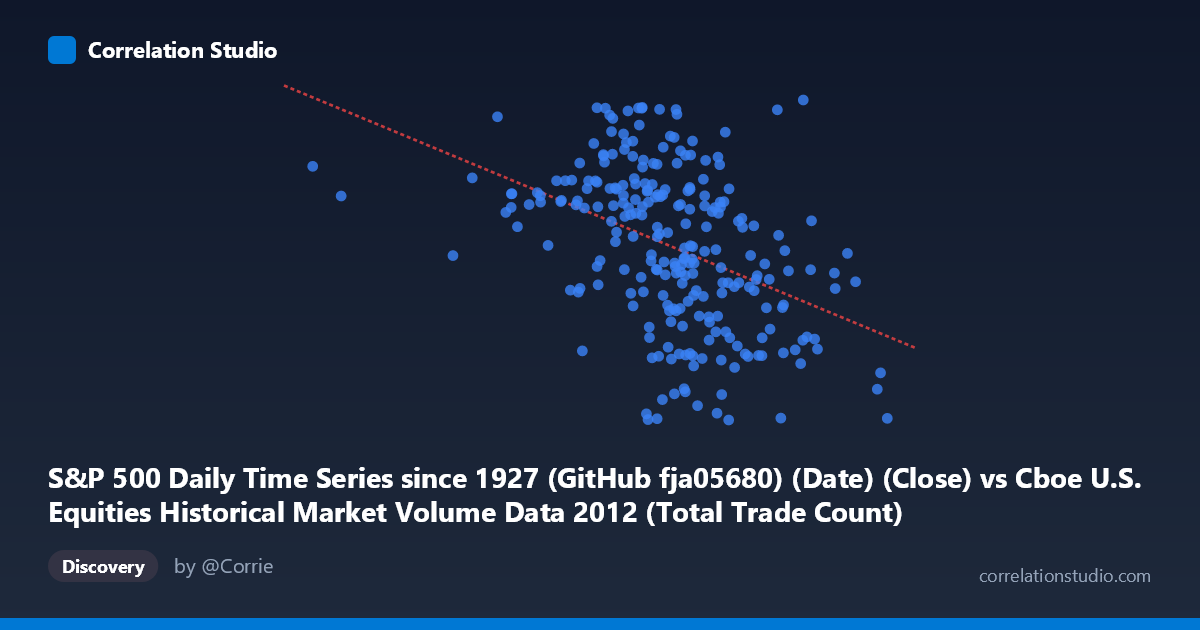
S&P 500 Daily Time Series since 1927 (GitHub fja05680) (Date) (Close) vs Cboe U.S. Equities Historical Market Volume Data 2012 (Total Trade Count)
- Pearson correlation (r)
- -0.4225
- Spearman correlation
- -0.4714
- p-value
- 0
- Sample size (n)
- 250
- 95% confidence interval
- -0.5194 to -0.315
- Granger causality
- None
- Granger optimal lag
- 2
AI analysis
Analysis: S&P 500 Close Price vs. U.S. Equities Total Trade Count (2012)
Relationship Overview The scatterplot reveals a moderate negative relationship between the S&P 500 daily closing price (X) and the total trade count across U.S. equity exchanges (Y). As the S&P 500 advanced through 2012 — rising from roughly 1,277 to 1,466 — overall market trade counts tended to decline. This is a somewhat counterintuitive finding at first glance, but it aligns with a well-documented structural shift in equity markets during this period: rising prices coincided with secular declines in high-frequency and retail trading activity following the post-2008/2010 volume peak. The linear regression equation (y = −8.29×10⁻⁵x + 1,515.92) quantifies this inverse slope, though the scatter around the line is clearly substantial.
Correlation Strength and Statistical Significance The Pearson correlation of r = −0.4225 indicates a moderate negative association, but the explanatory power is limited — r² = 0.1785 means only ~17.9% of the variance in trade count is explained by S&P 500 price level. The remaining ~82% of variability in daily trade counts is attributable to other factors entirely. The 95% confidence interval of [−0.519, −0.315] is meaningfully away from zero and relatively tight given n = 250, and the p-value of 3.03×10⁻¹² confirms this relationship is highly statistically significant — effectively ruling out chance as an explanation. However, statistical significance here is partly a function of the large underlying population (N = 3,750); practical significance should be judged by the modest r² rather than the p-value alone. Critically, the Granger causality tests show no significant predictive directionality in either direction (X→Y: F = 2.48, p = 0.086; Y→X: F = 0.45, p = 0.639), meaning that knowing today's S&P 500 price does not meaningfully help predict tomorrow's trade count, and vice versa. The relationship appears to be associative and structural rather than temporally predictive.
Patterns, Clusters, and Outliers The sample points reveal considerable vertical dispersion at most price levels, suggesting high day-to-day variability in trade counts independent of price. Several notable features are visible: there appears to be a cluster of high trade-count observations (1,420) concentrated in the lower price range (roughly 1,277–1,420 on the S&P), consistent with busier trading during the earlier, more volatile portion of 2012. A few potential outliers stand out — notably a point near (2,036,237, 1,465.77) representing a very high-volume day at the year's price peak, which partially contradicts the overall negative trend and may warrant individual investigation (e.g., index rebalancing, options expiration). The wide X-axis range (586,356 to 2,284,490 in trade count units) relative to the clustered bulk of observations suggests right-skewed volume distribution, with occasional extreme-volume days pulling the range.
Confounding Factors and Caveats Several important caveats apply. First, this is fundamentally a time-series correlation disguised as a cross-sectional one — both variables are evolving through calendar time in 2012, so much of the negative correlation may simply reflect that price trended upward while volume trended downward across the year, a spurious temporal coincidence rather than a causal mechanism. Secular volume decline in U.S. equities (post-2009 high-frequency trading normalization, reduced retail participation) was ongoing regardless of price direction. Second, day-of-week effects, earnings seasons, options expiration dates, and macroeconomic announcements all independently drive trade counts and could confound the relationship. Third, the dataset aggregates across all U.S. exchanges and TRFs, so compositional shifts (e.g., dark pool migration) could introduce noise unrelated to price levels.
Actionable Insights and Further Investigation Given the weak explanatory power and absent Granger causality, S&P 500 price level alone is a poor predictor of daily trade volume and should not be used in isolation for volume forecasting models. Recommended next steps include: (1) detrending both series before computing correlation to remove the shared temporal drift and test whether a genuine contemporaneous relationship persists; (2) incorporating VIX or realized volatility as a covariate, since volatility is the more theoretically grounded driver of trading activity; (3) conducting intraday analysis to determine whether the relationship strengthens at finer time resolution; and (4) breaking trade count down by exchange or trade type (lit vs. dark) to identify whether specific market segments drive the aggregate pattern. The Granger causality null result, while important, used only a 2-period lag — testing across a broader lag structure with an VAR framework could reveal more nuanced temporal dynamics.
X dataset: Cboe U.S. Equities Historical Market Volume Data 2012
Y dataset: S&P 500 Daily Time Series since 1927 (GitHub fja05680) (Date)
Part of experiment: Daily - Cboe U.S. Equities Historical Market Volume Data 2012 vs S&P 500 Daily Time Series since 1927 (GitHub fja05680) (Date)