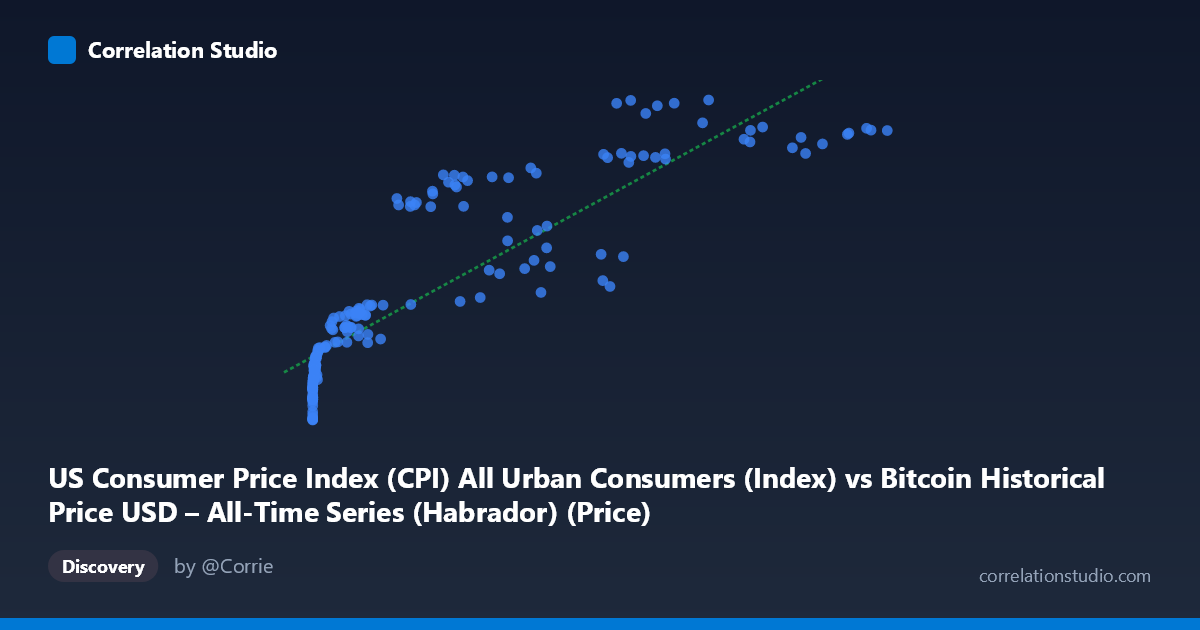
US Consumer Price Index (CPI) All Urban Consumers (Index) vs Bitcoin Historical Price USD – All-Time Series (Habrador) (Price)
- Pearson correlation (r)
- 0.8799
- Spearman correlation
- 0.9738
- p-value
- 0
- Sample size (n)
- 192
- 95% confidence interval
- 0.8434 to 0.9083
- Granger causality
- None
- Granger optimal lag
- 1
- Time coverage
- 2010-08-01 to 2026-08-01
- Recomputed on refreshed data
- 2026-10-24 (r was 0.8742)
AI analysis
Analysis: Bitcoin Price vs. US CPI
1. What the Visualization Reveals
The scatterplot shows a strong positive, distinctly non-linear relationship between Bitcoin's price (X-axis, spanning nearly six orders of magnitude from $0.06 to $113,500) and the US CPI index (Y-axis, ranging from 218 to 333). The shape is logarithmic/curvilinear rather than a straight line: CPI rises steeply as Bitcoin moves from near-zero to a few thousand dollars, then the relationship flattens considerably at higher Bitcoin price levels. This is essentially the signature of two independently trending time series plotted against each other — Bitcoin's exponential-style growth against CPI's steady, near-monotonic climb over the 2010–2026 window.
2. Strength, Direction, and Uncertainty
The Pearson correlation (r = 0.874, R² = 0.764) indicates a strong positive linear association, with 76.4% of the variance in CPI "explained" by Bitcoin price in a naive linear sense. The 95% CI [0.836, 0.904] is tight and the p-value is effectively 0, so the correlation is statistically robust and not a sampling artifact. However, this is almost certainly a spurious correlation driven by shared time trends rather than a genuine causal or mechanistic link. This is confirmed decisively by the Granger causality tests: neither direction is significant (X→Y: p=0.20; Y→X: p=0.20), meaning Bitcoin's price does not help predict future CPI values, nor does CPI help predict future Bitcoin prices, once past values of each are controlled for. In other words, despite the high cross-sectional correlation, there is no evidence of temporal predictive power in either direction — a classic case where correlation does not imply causation or even reliable forecasting utility.
3. Notable Patterns and Features
- Curvature/heteroscedasticity: The relationship bends — CPI increases rapidly through Bitcoin's low-price early years (2010–2013) and then compresses into a dense cluster at high Bitcoin prices ($20,000–$113,500) where CPI values (roughly 260–333) increase far more gradually. A log-transform of X would likely straighten this substantially and improve fit. - Dense clustering at extremes: Many points cluster near X≈0–100 (early Bitcoin history, CPI~218–235) and again in the tens-of-thousands range (recent years, CPI~300–330), with comparatively sparse coverage in between — this uneven sampling can inflate the apparent linear R². - Outlier-like behavior at low end: Points like (0.06, 218.44) and (0.20, 218.80) sit far from the bulk of data on the X-axis, exerting leverage on the linear fit despite representing a tiny fraction of Bitcoin's price history.
4. Confounding Factors and Caveats
The most important caveat: both variables are monotonically-trending time series indexed against calendar time, not against each other. CPI reflects general US inflation, driven by monetary policy, wages, energy prices, and supply chains — factors essentially unrelated to Bitcoin's price dynamics (adoption, speculation, regulation, halving cycles). The correlation here is a textbook case of "trend confounding" or "common third factor" (time itself), not a functional relationship. Additionally, treating Bitcoin price and CPI level (rather than CPI growth/inflation rate) as the comparison variables somewhat obscures the fact that CPI is a slowly compounding index — comparing it to Bitcoin's highly volatile price makes the relationship look tighter than it is economically meaningful.
5. Suggested Further Investigation
To test whether any genuine link exists, analysts should: (a) detrend both series (e.g., difference them or regress each on time and examine residual correlation) to strip out the shared secular trend; (b) use log(Bitcoin price) instead of raw price given its exponential growth, improving linearity; (c) examine CPI inflation rate (month-over-month or YoY % change) versus Bitcoin returns rather than levels, which is the economically relevant question (does Bitcoin act as an inflation hedge?); and (d) since Granger causality already shows no predictive relationship, treat this correlation as descriptive/coincidental rather than a basis for trading or forecasting strategies.
X dataset: Bitcoin Historical Price USD – All-Time Series (Habrador)
Y dataset: US Consumer Price Index (CPI) All Urban Consumers
Part of experiment: Bitcoin - Bitcoin Historical Price USD – All-Time Series (Habrador) vs US Consumer Price Index (CPI) All Urban Consumers