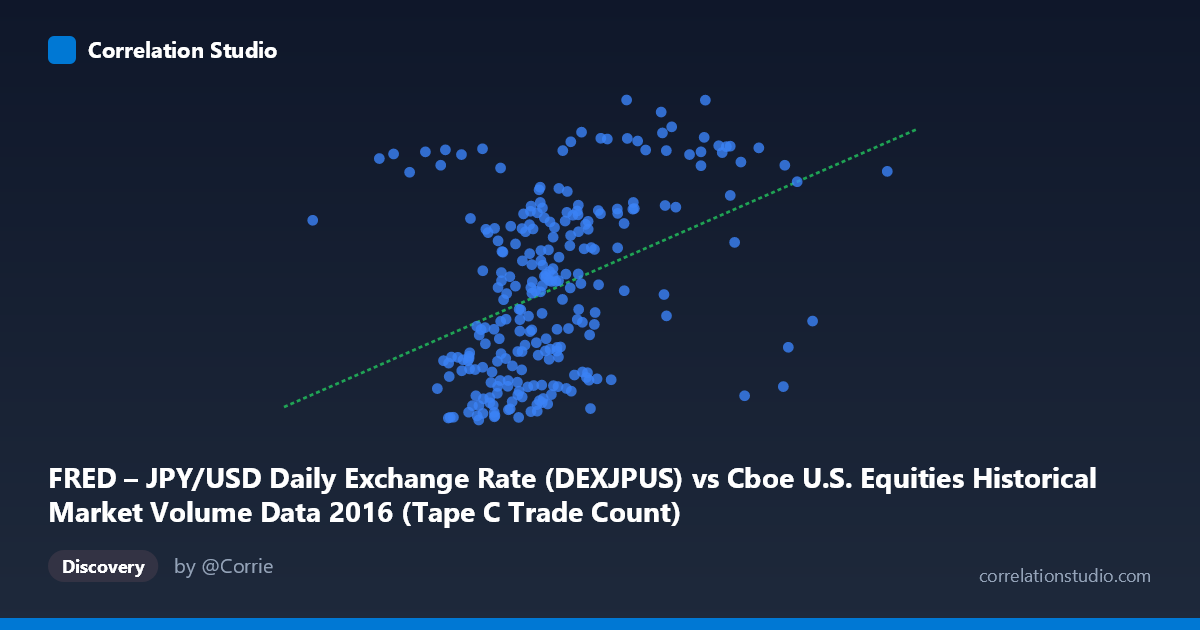
FRED – JPY/USD Daily Exchange Rate (DEXJPUS) vs Cboe U.S. Equities Historical Market Volume Data 2016 (Tape C Trade Count)
- Pearson correlation (r)
- 0.4029
- Spearman correlation
- 0.4399
- p-value
- 0
- Sample size (n)
- 250
- 95% confidence interval
- 0.2936 to 0.5019
- Granger causality
- Y → X
- Granger optimal lag
- 1
- Time coverage
- 2016-01-04 to 2016-12-30
- Recomputed on refreshed data
- 2026-10-20 (r was 0.4029)
AI analysis
Scatterplot Analysis: JPY/USD Exchange Rate vs. Cboe Tape C Trade Count (2016)
Relationship Overview
The scatterplot reveals a modest positive relationship between the FRED JPY/USD daily exchange rate (X-axis, representing U.S. equity market volume data) and the Cboe Tape C trade count (Y-axis, representing the yen-per-dollar exchange rate). As market volume increases, the JPY/USD rate tends to drift upward, suggesting that higher U.S. equity trading activity coincides with a stronger dollar relative to the yen. However, the relationship is far from deterministic — the scatter is wide and considerable variance exists at virtually every level of X, indicating many other forces are at play across the 2016 trading year.
Correlation Strength and Statistical Interpretation
The Pearson correlation of r = 0.40 signals a weak-to-moderate positive association. More critically, r² = 0.1624 means only 16.2% of the variance in the JPY/USD rate is explained by trade volume — leaving roughly 84% attributable to other factors entirely. The 95% confidence interval of [0.29, 0.50] is meaningfully bounded away from zero, and the p-value of 3.54 × 10⁻¹¹ confirms this is not a chance finding given the sample of 250 paired observations drawn from a population of 3,622. That said, statistical significance here is largely a function of sample size; the practical magnitude of the effect is modest. The Granger causality results are particularly illuminating: the relationship is unidirectional — Y Granger-causes X (F = 4.40, p = 0.037), while X does not Granger-cause Y (F = 0.28, p = 0.596). This means the JPY/USD exchange rate has temporal predictive power over subsequent U.S. equity market volume at a one-period lag, but not vice versa. Currency markets appear to lead equity volume, not the other way around.
Notable Patterns, Clusters, and Outliers
The bulk of observations cluster between X values of roughly 550,000–900,000 and Y values between 100–115, forming a dense central cloud with a gentle upward tilt. Several notable outliers warrant attention: two points at X ≈ 1,143,000 and X ≈ 1,187,000 represent extreme volume days well outside the main distribution, yet their Y values (≈104–107) are surprisingly unremarkable — suggesting very high trading volume did not coincide with unusual currency moves. On the high-Y end, a point near (849,000, 121.1) stands out as an extreme JPY/USD value, indicating a specific day of notable dollar strength. These outliers may exert disproportionate leverage on the regression line (y = 1.58 × 10⁻⁵x + 97.35) and deserve individual investigation.
Confounding Factors and Interpretive Caveats
Several important caveats apply. First, the axis labels appear inverted from their dataset descriptions — the X variable is labeled as coming from the Cboe volume dataset while the Y variable is labeled from FRED's exchange rate series, which is worth verifying before drawing firm conclusions. Second, both variables are time-indexed through 2016, meaning shared macro trends — Federal Reserve policy shifts, the U.S. presidential election, global risk-off episodes — could be driving co-movement spuriously. Third, Tape C trade count is one narrow slice of U.S. equity activity; aggregating all exchange tapes might reveal a different picture. Finally, the one-period Granger lag is calendar-day based, and the true leading relationship may operate on intraday or weekly timescales not captured here.
Actionable Insights and Further Investigation
Given that JPY/USD Granger-causes equity volume, currency traders and market microstructure researchers should examine whether exchange rate volatility (not just level) predicts volume spikes more robustly. It would be worth testing whether implied volatility (VIX) or USD Index mediates the relationship, potentially absorbing much of the unexplained 84% variance. Extending the analysis to multiple years would distinguish a 2016-specific phenomenon (driven by election uncertainty and BOJ policy) from a structural relationship. Researchers should also apply rolling-window correlation to assess whether the r = 0.40 relationship is stable across the year or driven by specific high-volatility regimes. Finally, a multivariate regression controlling for VIX, interest rate differentials, and day-of-week effects would provide a far more actionable and defensible model than the bivariate relationship alone.
X dataset: Cboe U.S. Equities Historical Market Volume Data 2016
Y dataset: FRED – JPY/USD Daily Exchange Rate
Part of experiment: Daily - Cboe U.S. Equities Historical Market Volume Data 2016 vs FRED – JPY/USD Daily Exchange Rate