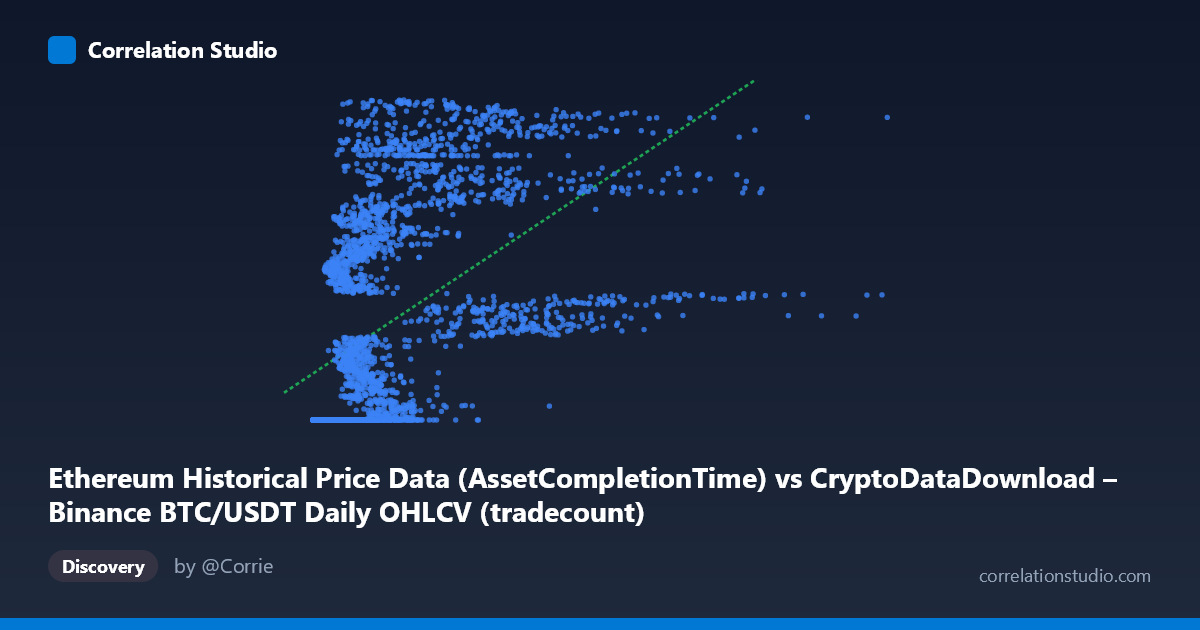
Ethereum Historical Price Data (AssetCompletionTime) vs CryptoDataDownload – Binance BTC/USDT Daily OHLCV (tradecount)
- Pearson correlation (r)
- 0.5262
- Spearman correlation
- 0.7892
- p-value
- 0
- Sample size (n)
- 3191
- 95% confidence interval
- 0.5007 to 0.5509
- Granger causality
- None
- Granger optimal lag
- 10
- Time coverage
- 2017-08-17 to 2026-05-20
AI analysis
Analysis of Ethereum/Bitcoin Data Relationship
1. What the Visualization Reveals
The scatterplot shows a moderate positive relationship between the X variable (labeled as Ethereum price data, though mismatched with the described BTC/USDT column) and Y (tradecount). The pattern is distinctly non-linear: at low X values (roughly under 500,000), Y appears clustered tightly near a floor value (~1,614,335,000–1,614,336,000), suggesting a threshold or saturation effect rather than a proportional relationship. As X increases beyond this range, Y rises more steeply and with greater dispersion, indicating the relationship strengthens or changes character at higher X values. This is a classic signature of a curve that a simple straight line will underfit at both ends.
2. Strength, Direction, and Statistical Confidence
The Pearson correlation (r = 0.526) indicates a moderate positive linear association, with r² = 0.277 meaning linear regression explains only ~28% of the variance in Y — the majority of variance remains unaccounted for by a linear model. The tight 95% CI [0.501, 0.551] and p-value of 0 confirm this correlation is highly statistically significant and precisely estimated, not a product of sampling noise — but statistical significance here reflects the large sample size (n=3,191) rather than strong practical explanatory power. Critically, the Granger causality tests show no significant predictive direction in either direction (X→Y: p=0.446; Y→X: p=0.661), meaning that despite the contemporaneous correlation, neither variable's past values help forecast the other's future values at daily lags up to 10 periods. This strongly suggests the correlation is not causal in a time-series sense, but likely reflects a shared underlying driver (e.g., both series trending with overall crypto market cycles or calendar time).
3. Notable Patterns and Non-linear Features
The most striking feature is the "floor" cluster: dozens of points with X values under ~500,000 all map to nearly identical Y values around 1,614,335,000–1,614,336,000, varying by only a few hundred units despite X spanning a wide range. This looks like either (a) a data artifact/placeholder value used before real data collection began, or (b) a genuine period of flat/stagnant activity. Above this threshold, Y increases with X but shows substantial scatter, including points that reach into the 1.74–1.78 billion range at relatively modest X values (2–5 million), while other points with similar X remain much lower — indicating additional variance drivers beyond X alone. The note that Spearman ρ exceeds Pearson r reinforces that the true relationship is monotonic but curved (likely logarithmic or a threshold/saturation curve), not linear.
4. Confounding Factors and Caveats
Several caveats limit interpretation: - Metadata mismatch: The X-axis is labeled as Ethereum price data but described as coming from a BTC/USDT dataset, and Y (tradecount) is attributed to an Ethereum dataset labeled with a BTC/USDT description. This suggests possible column/dataset mislabeling that should be resolved before drawing substantive conclusions. - Time confound: Both cryptocurrency prices and trade counts trend upward over multi-year periods (2017–2026) alongside overall market growth and exchange adoption — this shared temporal trend can inflate correlation without any direct causal link between the two specific variables. - The floor-value cluster may represent missing/imputed data rather than real observations, artificially anchoring the regression and reducing the fitted r². - Non-stationarity: Both price and trade-count series in crypto markets are typically non-stationary (trending, volatile), which can produce spurious correlations in simple Pearson/regression frameworks even when Granger tests (usually run on differenced/stationary series) show no lead-lag relationship.
5. Recommendations for Further Investigation
1. Verify variable labeling — confirm which exchange/asset each column truly represents before further modeling. 2. Fit non-linear models (logarithmic, power, or piecewise/threshold regression) given the Spearman-Pearson gap and visible curve shape; a log-transform of X may substantially improve fit. 3. Investigate the floor cluster separately — determine if it's a data quality issue (placeholder values) or a genuine early low-activity regime, and consider excluding/flagging it. 4. De-trend or difference both series before re-running correlation/Granger tests to control for shared time trends and assess whether the moderate correlation persists or vanishes — this would clarify whether the relationship is genuine co-movement or trend confounding. 5. Given the lack of Granger causality, avoid using one series to forecast the other in trading or predictive models; instead, treat both as jointly driven by broader market conditions (e.g., overall crypto sentiment, macro liquidity) and consider adding a third causal variable to the analysis.
X dataset: CryptoDataDownload – Binance BTC/USDT Daily OHLCV
Y dataset: Ethereum Historical Price Data
Part of experiment: Bitcoin - CryptoDataDownload – Binance BTC/USDT Daily OHLCV vs Ethereum Historical Price Data