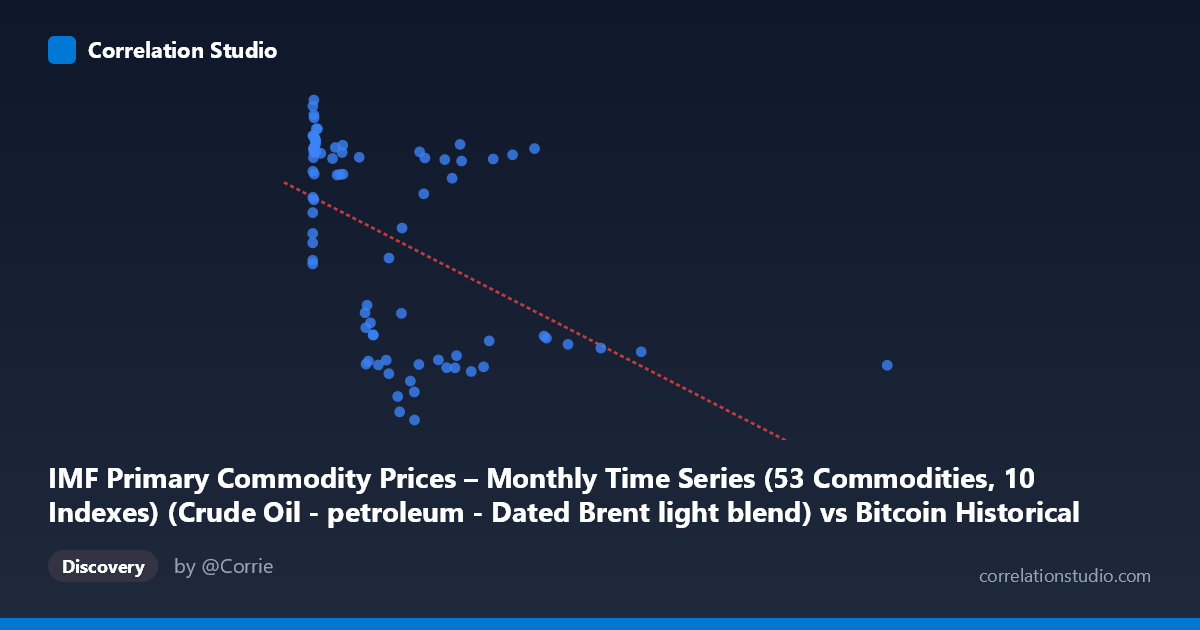
IMF Primary Commodity Prices – Monthly Time Series (53 Commodities, 10 Indexes) (Crude Oil - petroleum - Dated Brent light blend) vs Bitcoin Historical Price USD – All-Time Series (Habrador) (Price)
- Pearson correlation (r)
- -0.4929
- Spearman correlation
- -0.5415
- p-value
- 0.000002
- Sample size (n)
- 83
- 95% confidence interval
- -0.6405 to -0.3102
- Granger causality
- None
- Granger optimal lag
- 6
AI analysis
Analysis: Bitcoin Price vs. Brent Crude Oil Index
1. Overall Relationship
The scatterplot reveals a moderate negative, non-linear relationship between Brent crude oil prices (X) and Bitcoin's historical price (Y). Rather than a clean linear trend, the data shows a distinctive pattern: Bitcoin prices cluster in two "regimes" — a high-value cluster (roughly Y=95–125) concentrated at very low oil price readings (X<40), and a more dispersed, lower-value cluster (Y=30–110) spread across a wide range of oil prices (X=100–2450). This suggests the relationship is being driven substantially by time period rather than direct causal interaction.
2. Strength, Direction, and Statistical Confidence
The correlation coefficient (r = -0.493) indicates a moderate negative association, with r² = 0.243 meaning only about 24% of Bitcoin's price variance is statistically explained by oil prices — leaving roughly 76% attributable to other factors. The 95% CI [-0.64, -0.31] is reasonably tight and excludes zero, and the p-value (2.2×10⁻⁶) confirms this correlation is highly unlikely to be due to chance. However, correlation strength here should not be mistaken for practical predictive power given the modest r². Critically, the Granger causality tests (both directions non-significant, p=0.235 and p=0.163) indicate no evidence of temporal predictive causality in either direction — oil prices don't help forecast future Bitcoin prices, and vice versa, even at the optimal 6-period lag. This strongly suggests the correlation is coincidental or driven by a shared external trend rather than genuine causal linkage.
3. Notable Patterns and Outliers
The most striking feature is the extreme leverage point at X=2452.18 (Y=46.89) — a massive outlier in oil pricing units far removed from the rest of the data (next highest is ~1400). This single point could be disproportionately influencing the linear regression slope. Additionally, there's a dense vertical cluster near X≈0–15 with highly variable Y values (77–125), suggesting this X-range corresponds to early Bitcoin history (2010-2011) when prices were low and volatile regardless of oil prices — essentially a "startup noise" cluster. A second cluster around X=200–650 shows Bitcoin values split between a low band (~30–65) and high band (~100–112), hinting at a regime shift (likely 2014-2015 crash vs. later recovery) rather than a continuous functional relationship with oil price.
4. Confounding Factors and Caveats
The most important caveat: this is likely a spurious correlation driven by shared temporal trends, not a genuine economic relationship. Both Bitcoin adoption/price appreciation and oil price cycles occurred over 2010-2017, but through entirely different mechanisms (crypto speculation/adoption curves vs. OPEC supply decisions, geopolitical events, global demand). The lack of Granger causality reinforces that any relationship is not predictive but merely contemporaneous drift — both series may be picking up long-term macro trends (e.g., USD strength, post-2014 commodity slump coinciding with Bitcoin's pre-2017 bull run) or simply the passage of time. The clustering by era (rather than smooth covariation) further suggests time itself, not oil price, is the latent driver.
5. Recommendations for Further Investigation
Given the non-linear clustering, a piecewise or time-segmented analysis (e.g., separate correlations for 2010-2013, 2014-2015, 2016-2017) would clarify whether the relationship is stable or artifact-driven. Detrending both series (e.g., using returns/log-differences instead of levels) would help distinguish genuine co-movement from shared trend/non-stationarity — this is essential since both series are likely non-stationary, which can produce misleading correlations. Given the null Granger causality result, treating this as a predictive trading signal is not advisable; instead, investigate common macro drivers (USD index, global risk sentiment, interest rates) as potential confounders explaining both series simultaneously.
X dataset: Bitcoin Historical Price USD – All-Time Series (Habrador)
Y dataset: IMF Primary Commodity Prices – Monthly Time Series (53 Commodities, 10 Indexes)
Part of experiment: Bitcoin - Bitcoin Historical Price USD – All-Time Series (Habrador) vs IMF Primary Commodity Prices – Monthly Time Series (53 Commodities, 10 Indexes)