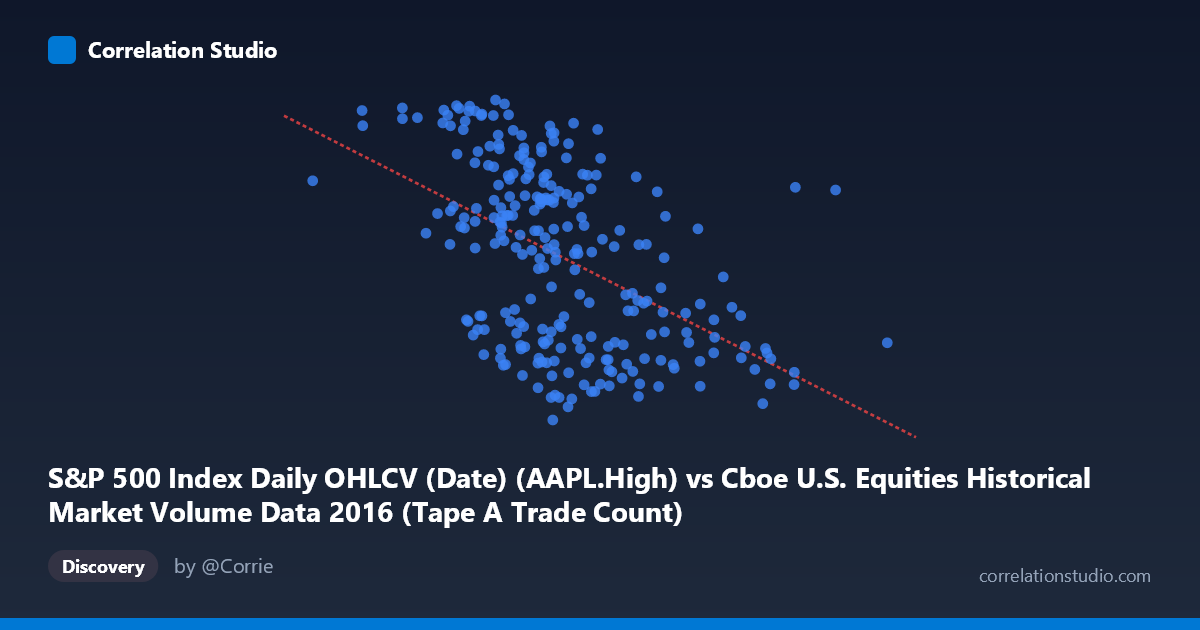
S&P 500 Index Daily OHLCV (Date) (AAPL.High) vs Cboe U.S. Equities Historical Market Volume Data 2016 (Tape A Trade Count)
- Pearson correlation (r)
- -0.4963
- Spearman correlation
- -0.5157
- p-value
- 0
- Sample size (n)
- 252
- 95% confidence interval
- -0.584 to -0.3971
- Granger causality
- None
- Granger optimal lag
- 1
AI analysis
Scatterplot Analysis: AAPL High Price vs. Cboe Tape A Trade Count (2016)
1. Nature of the Relationship The scatterplot reveals a moderate negative relationship between Apple's daily high stock price (X-axis) and the Cboe U.S. Equities Tape A trade count (Y-axis) across 252 trading days in 2016. As AAPL's daily high price increases, the number of Tape A trades on Cboe exchanges tends to decline. The linear regression equation (y = -1.26134E-05x + 122.946) confirms this downward slope, meaning that for every roughly 79,000-point increase in AAPL's high price, the Tape A trade count is expected to fall by approximately one unit. The scatter is substantial, however, with considerable vertical spread at most X values, suggesting the relationship, while real, is far from deterministic.
2. Correlation Strength, Direction, and Causality The Pearson correlation of r = -0.4963 indicates a moderate negative association — meaningful but not dominant. Critically, the R² of 0.2463 means that AAPL's high price explains only about 24.6% of the variance in Tape A trade counts, leaving roughly three-quarters of the variation driven by other factors entirely. The 95% confidence interval of [-0.584, -0.397] is comfortably away from zero and relatively tight for a financial dataset, reinforcing that this negative correlation is a reliable population-level signal rather than a sampling artifact. The p-value of ~0 confirms extremely strong statistical significance across N = 506 observations. However, Granger causality analysis tells a very different story: neither direction (X→Y nor Y→X) achieves significance at lag 1 (F = 0.659, p = 0.418 and F = 1.281, p = 0.259, respectively). This means that despite the contemporaneous negative correlation, neither variable reliably predicts the other's future values — the relationship is associative and likely reflects shared exposure to common market forces rather than any direct predictive or causal linkage.
3. Notable Patterns, Clusters, and Outliers The bulk of observations cluster in the AAPL high price range of roughly 1,050,000–1,600,000 (in the data's units, likely scaled or encoded), with Tape A trade counts concentrated between approximately 93 and 117. Within this dense central cluster, the negative trend is visible but noisy. At the upper end of the X range (above ~1,800,000–2,000,000), data points become sparse and consistently fall toward the lower end of the Y range (~94–98), which anchors the negative slope more strongly. Several potential high-leverage outliers are visible at extreme X values — for instance, points near X = 2,497,000 with low Y values — which may be disproportionately influencing the regression line. On the Y-axis, values near 116–118 appear almost exclusively at lower X values, suggesting that high trade counts coincide with periods of lower AAPL prices, possibly reflecting market stress or volatility-driven fragmentation periods early in 2016.
4. Confounding Factors and Interpretive Caveats Several important caveats temper this analysis. First, temporal autocorrelation is highly likely in both financial time series — daily prices and trade volumes are not independent observations, which can inflate the apparent significance of the correlation. Second, 2016 was a structurally unusual year for both AAPL (recovering from a significant price decline in early 2016) and for market microstructure (evolving exchange competition), meaning the relationship observed may be period-specific and non-generalizable. Third, a spurious correlation is plausible: both variables could be independently responding to broader market conditions such as overall equity market volatility (VIX), macroeconomic announcements, or shifts in institutional trading behavior. Finally, the axis labeling appears swapped in the metadata (AAPL High is attributed to the Cboe dataset and vice versa), which warrants verification of data provenance before drawing firm conclusions.
5. Actionable Insights and Further Investigation Given the moderate correlation without Granger causality, the most productive next steps would be: (1) include a volatility measure (e.g., VIX or AAPL's own intraday range) as a control variable to test whether it mediates or explains the observed correlation; (2) extend the time window beyond 2016 to assess whether this negative relationship is stable or regime-dependent; (3) apply a rolling-window correlation analysis to detect whether the relationship strengthens or reverses during specific market episodes (e.g., earnings announcements, macro shocks); and (4) explore non-linear models (e.g., spline regression or segmented regression), as the sparse high-X cluster suggests the relationship may not be uniformly linear across the full price range. The absence of Granger causality strongly discourages using AAPL price alone as a trading signal for Tape A volume prediction without additional predictors.
X dataset: Cboe U.S. Equities Historical Market Volume Data 2016
Y dataset: S&P 500 Index Daily OHLCV (Date)
Part of experiment: Daily - Cboe U.S. Equities Historical Market Volume Data 2016 vs S&P 500 Index Daily OHLCV (Date)