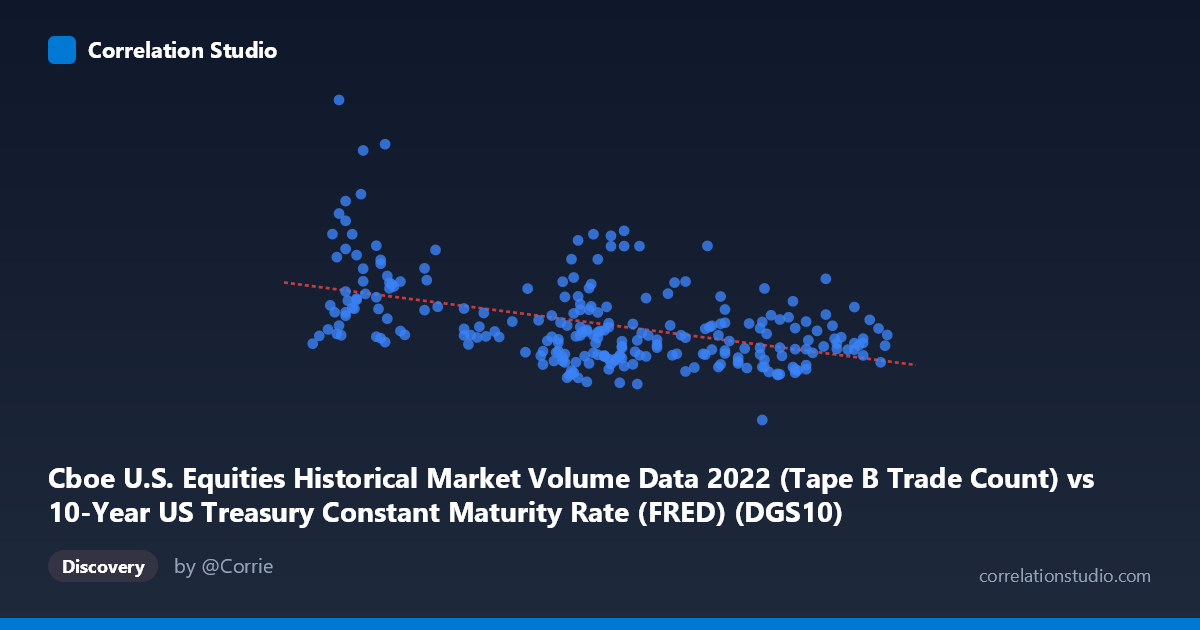
Cboe U.S. Equities Historical Market Volume Data 2022 (Tape B Trade Count) vs 10-Year US Treasury Constant Maturity Rate (FRED) (DGS10)
- Pearson correlation (r)
- -0.4686
- Spearman correlation
- -0.4216
- p-value
- 0
- Sample size (n)
- 249
- 95% confidence interval
- -0.5603 to -0.3656
- Granger causality
- None
- Granger optimal lag
- 10
AI analysis
Analysis: Cboe Tape B Trade Count vs. 10-Year US Treasury Yield (2022)
Relationship Overview The scatterplot reveals a moderate negative relationship between Cboe U.S. Equities Tape B trade counts and the 10-year US Treasury constant maturity rate across 2022. The linear regression equation (y = -110,870x + 867,994) indicates that for each one-unit increase in the Treasury yield, trade counts decline by approximately 110,870 units on average. Visually, this downward trend is discernible but noisy — the data cloud is wide and dispersed, suggesting the relationship is real but far from deterministic. The spread of points across the full X range (roughly 1.63% to 4.25% yield) captures a historically unusual year, as 2022 saw the Federal Reserve aggressively hiking rates from near-zero levels, compressing the yield range into a directional march upward.
Correlation Strength and Statistical Significance The Pearson correlation of r = -0.4686 reflects a moderate negative association — meaningful, but leaving the majority of variance unexplained. Critically, R² = 0.2196, meaning only about 22% of the variance in trade counts is explained by Treasury yields, with the remaining 78% attributable to other factors. The 95% confidence interval of [-0.5603, -0.3656] is relatively narrow and does not cross zero, and the p-value of 5.33 × 10⁻¹⁵ is extraordinarily small given N = 4,769, confirming this is not a chance finding. However, statistical significance here is partly a function of the large population size — a correlation of this magnitude should not be mistaken for a strong or practically dominant relationship. The Granger causality results are notably absent of significance in either direction (X→Y: F = 1.37, p = 0.194; Y→X: F = 0.99, p = 0.454), meaning that neither variable meaningfully predicts future values of the other in a temporal sense. This tempers any causal interpretation and suggests the correlation may reflect shared exposure to common macro drivers rather than a direct lead-lag mechanism.
Patterns, Clusters, and Outliers Several features stand out in the data distribution. At lower yield values (roughly 1.63%–2.20%), there is considerably more vertical scatter, with trade counts ranging from below 500,000 to above 1,200,000 — suggesting high volatility in market activity during the low-rate early-2022 period. A handful of notable high outliers are visible at low X values (e.g., ~1.86%, 1,212,395 and ~1.81%, 888,291), which may correspond to specific high-volatility sessions in January–February 2022 before the Fed's hiking cycle began in earnest. As yields rise toward the 3.5%–4.25% range, trade counts cluster more tightly in a lower band (roughly 350,000–550,000), indicating both reduced activity and reduced dispersion. This heteroscedasticity — wider spread at low yields, tighter at high yields — is an important structural feature suggesting the variance itself is yield-dependent.
Confounding Factors and Caveats Several important caveats apply. First, 2022 was a structurally unique year: the Fed raised rates by 425 basis points, meaning X (yield) is not randomly distributed but follows a strong temporal trend, making yield itself a proxy for "time in 2022." Many other market structure factors — VIX levels, equity index drawdowns, macro event clustering — also evolved systematically across the year, making it difficult to isolate yield as an independent driver. Second, Tape B specifically covers regional exchanges (NYSE American, NYSE Arca, etc.), and volume dynamics on these venues may reflect fragmentation and routing decisions rather than pure investor sentiment. Third, the dataset labels appear transposed in their column-dataset pairing (the yield column is described as coming from a volume dataset and vice versa), which warrants verification before drawing firm conclusions. Finally, the absence of Granger causality in either direction at up to 10 lags suggests that any relationship is contemporaneous and driven by common factors, not predictive.
Actionable Insights and Further Investigation Practitioners and researchers should treat this correlation as a descriptive macro signal rather than a trading or predictive tool. The moderate negative relationship is consistent with the intuition that rising rates in 2022 coincided with declining equity market activity and risk appetite, but the 78% unexplained variance demands richer modeling. Recommended next steps include: (1) controlling for VIX and S&P 500 returns as covariates to isolate the yield effect on trade volume; (2) segmenting the analysis by Fed meeting cycles to test whether rate decision dates create structural breaks in the correlation; (3) comparing Tape B to Tape A and Tape C volume to assess whether this relationship is venue-specific or market-wide; and (4) applying rolling-window correlation analysis to test whether the r = -0.47 relationship was stable across 2022 or concentrated in specific sub-periods (e.g., the sharp rate acceleration in Q2). Given the non-causal Granger result, using yield alone to forecast trading volume would be inadvisable without a richer multivariate framework.
X dataset: 10-Year US Treasury Constant Maturity Rate (FRED)
Y dataset: Cboe U.S. Equities Historical Market Volume Data 2022
Part of experiment: Daily - 10-Year US Treasury Constant Maturity Rate (FRED) vs Cboe U.S. Equities Historical Market Volume Data 2022