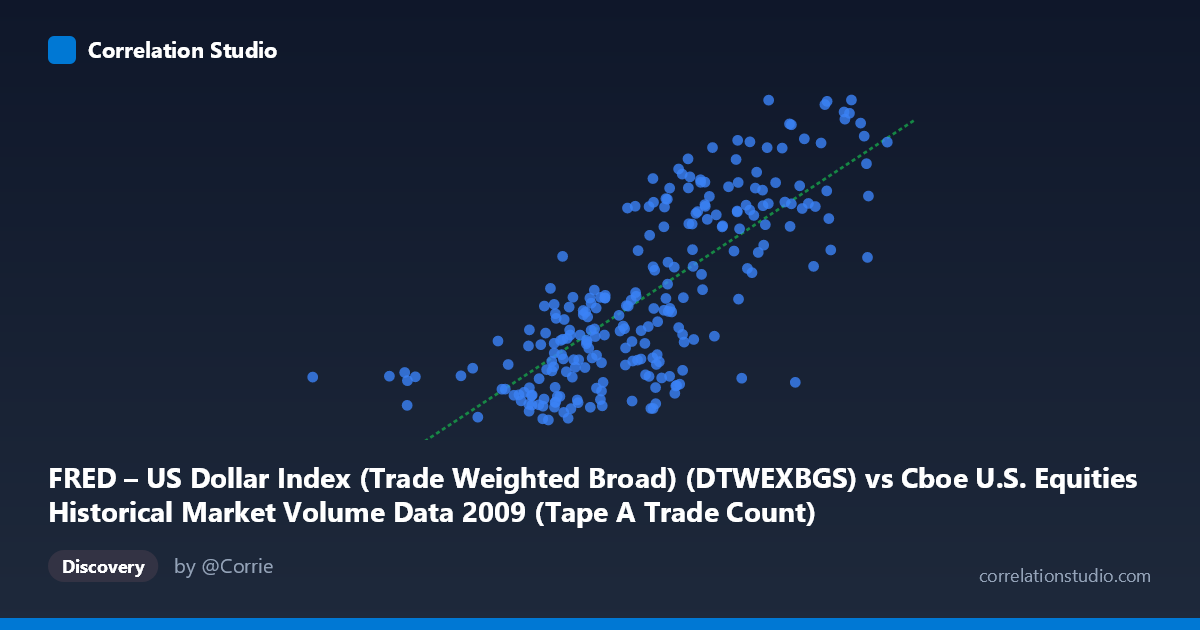
FRED – US Dollar Index (Trade Weighted Broad) (DTWEXBGS) vs Cboe U.S. Equities Historical Market Volume Data 2009 (Tape A Trade Count)
- Pearson correlation (r)
- 0.7649
- Spearman correlation
- 0.7529
- p-value
- 0
- Sample size (n)
- 248
- 95% confidence interval
- 0.7078 to 0.8121
- Granger causality
- None
- Granger optimal lag
- 1
AI analysis
Scatterplot Analysis: US Dollar Index vs. Cboe Tape A Trade Count (2009)
Relationship Overview The scatterplot reveals a moderately strong positive relationship between the US Dollar Index (Trade Weighted Broad) and Cboe Tape A Trade Count across 2009. As the dollar index increases, trade counts tend to rise as well. The linear regression equation (y = 8.178×10⁻⁶x + 83.37) confirms this upward trajectory, though the scatter around the regression line suggests meaningful unexplained variation. Visually, the data points form a broadly upward-sloping cloud, with higher X values (roughly above 2,000,000) clustering near higher Y values (100–106), while lower X values tend to concentrate in the 91–97 range.
Correlation Strength and Statistical Significance The Pearson correlation of r = 0.765 indicates a moderately strong positive association. The coefficient of determination r² = 0.585 means that approximately 58.5% of the variance in Tape A Trade Count is statistically explained by the Dollar Index — a meaningful but far from complete relationship, leaving ~41.5% attributable to other factors. The 95% confidence interval [0.708, 0.812] is relatively narrow and sits comfortably above zero, reflecting good precision given the sample of n = 248 drawn from a population of N = 3,232. The p-value of effectively 0 confirms this correlation is highly unlikely to be a chance artifact. However, the Granger causality tests tell a more cautionary story: neither direction (X→Y: F = 0.889, p = 0.347; Y→X: F = 0.197, p = 0.657) achieves significance at any conventional threshold. This means that despite the strong contemporaneous correlation, neither variable meaningfully predicts the other on the following trading day — a critical distinction that tempers any causal interpretation.
Patterns, Clusters, and Outliers The data exhibit a loose but discernible bimodal clustering: a lower-left cluster roughly spanning X = 362,000–1,600,000 and Y = 90–97, and an upper-right cluster around X = 1,900,000–2,550,000 and Y = 98–106. This separation may reflect distinct market regimes within 2009 — the acute crisis/recovery phase early in the year versus the sustained rally later. A notable outlier is the point at (362,081; 92.87), which lies far to the left of all other observations and likely represents a thin-volume or anomalous trading session deserving scrutiny. A few points in the upper-right cluster (e.g., ~2,097,703; 106.02 and ~2,387,936; 105.12) appear at the extreme of both axes and may exert leverage on the regression line. The relationship also appears to exhibit slight non-linearity — the lower-X region shows more vertical spread, hinting that variance in trade counts is less constrained when volume is low.
Confounding Factors and Caveats Several important caveats apply. First, 2009 was an extraordinary year — the post-Lehman crisis trough (March 2009) and subsequent strong equity recovery create a natural temporal arc where both equity market activity and dollar dynamics shifted dramatically, meaning the correlation may largely reflect shared time-trend co-movement rather than a direct structural link. Second, the axes are swapped in labeling (X is described as dollar index in the header but the dataset attribution appears reversed between axes — this should be verified before drawing conclusions). Third, omitted variables such as VIX (volatility), S&P 500 returns, Federal Reserve interventions, and seasonal liquidity patterns could be driving both series simultaneously. Fourth, with daily data, serial autocorrelation is almost certain, which can inflate the apparent precision of the correlation estimate despite the large sample size.
Actionable Insights and Further Investigation Given the lack of Granger causality, practitioners should not attempt to use dollar index levels as a same-lag predictor of trade counts for tactical trading signals. However, the strong contemporaneous r² = 0.585 warrants exploring whether a regime-switching or structural break model better captures the two apparent clusters. Future analysis should: (1) partial out the time trend to test whether the correlation persists after detrending both series; (2) introduce VIX and S&P 500 returns as controls to assess whether the dollar-volume link survives multivariate scrutiny; (3) test longer Granger lags (beyond the optimal lag-1 used here) since institutional FX-equity linkages may operate over weekly rather than daily horizons; and (4) investigate the extreme low-volume outlier at X ≈ 362,081 to confirm it is not a data error. Extending this analysis to other years would also clarify whether 2009's crisis context is essential to the observed relationship.
X dataset: Cboe U.S. Equities Historical Market Volume Data 2009
Y dataset: FRED – US Dollar Index (Trade Weighted Broad)
Part of experiment: Daily - Cboe U.S. Equities Historical Market Volume Data 2009 vs FRED – US Dollar Index (Trade Weighted Broad)