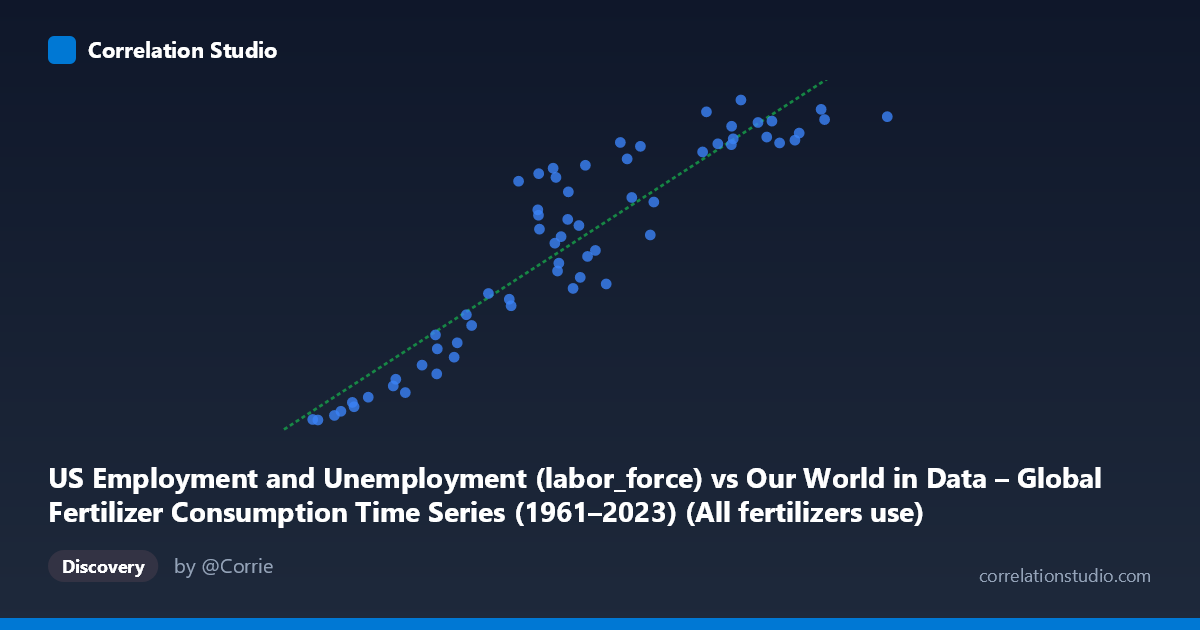
US Employment and Unemployment (labor_force) vs Our World in Data – Global Fertilizer Consumption Time Series (1961–2023) (All fertilizers use)
- Pearson correlation (r)
- 0.9217
- Spearman correlation
- 0.92
- p-value
- 0
- Sample size (n)
- 63
- 95% confidence interval
- 0.8734 to 0.952
- Granger causality
- Bidirectional
- Granger optimal lag
- 10
- Time coverage
- 1961-01-01 to 2023-01-01
AI analysis
Analysis: US Labor Force vs. Global Fertilizer Consumption (1961–2023)
Relationship Overview The scatterplot reveals a strong, positive linear relationship between the US labor force size and global fertilizer consumption over the period 1961–2023. As global fertilizer use has expanded dramatically — from roughly 3.2 million to 22.7 million units — the US labor force has grown correspondingly from approximately 70,000 to 167,000 (thousands). The linear regression equation (y = 0.00572x + 55,150) fits this trend well, and the data points cluster reasonably tightly around the regression line across the full range, suggesting a consistent co-movement across six decades rather than a relationship confined to a particular era.
Correlation Strength and Statistical Interpretation The correlation is very strong (r = 0.922), and the R² of 0.850 indicates that approximately 85% of the variance in US labor force size is statistically explained by global fertilizer consumption within this sample — a remarkably high figure for two seemingly unrelated macroeconomic and agricultural indicators. The 95% confidence interval [0.873, 0.952] is narrow and entirely positive, reinforcing high confidence in the direction and magnitude of the association. The p-value of essentially zero confirms this is not a chance finding given the sample. The Granger causality results, however, complicate any causal narrative: bidirectional Granger causality is detected at a 10-period lag (X→Y: F=2.32, p=0.035; Y→X: F=2.19, p=0.045), meaning each variable has marginal predictive power over the other's future values. Critically, this bidirectionality strongly suggests both variables are being driven by a common underlying process — likely global economic and population growth — rather than either causing the other.
Patterns, Clusters, and Outliers The data distributes fairly continuously along the regression line, reflecting the smooth, secular growth trends of both variables over time. There is mild heteroscedasticity visible in the mid-range (X ≈ 10–14 million), where vertical scatter is noticeably wider — several points deviate significantly from the regression line (e.g., points around X ≈ 10–12 million show Y values ranging from ~105,000 to ~147,000 for similar X values). This mid-range dispersion likely corresponds to the 1980s–1990s, when US labor force growth was turbulent (recessions, female labor force entry acceleration) while global fertilizer use was more volatile. The lower-left cluster (early 1960s data) and upper-right cluster (2000s–2020s) are relatively tight, suggesting the relationship was more stable at the extremes of the time series.
Confounding Factors and Caveats This correlation is almost certainly a spurious long-run co-trend driven by confounding factors rather than any genuine causal mechanism between fertilizer use and US employment. Both variables are primarily driven by global population growth, GDP expansion, and post-WWII industrialization — all of which independently explain upward secular trends in both agricultural inputs and labor supply over this period. The use of annual aggregates over 63 years means that nearly any two monotonically increasing time series from this era would produce high correlations. Additionally, the datasets are conceptually mismatched: one is a global agricultural aggregate (fertilizer consumption worldwide) while the other is a national labor market measure (US labor force), making any direct mechanistic interpretation implausible. The Granger causality, while statistically present, operates at a 10-period (decade-long) lag, which further undermines any practical predictive interpretation.
Actionable Insights and Further Investigation The most important next step is detrending both series (e.g., first-differencing or removing a common population/GDP trend) to determine whether any genuine short-run relationship exists beyond their shared long-run growth trajectories. Analysts should also test whether including world population or global GDP as a covariate eliminates the apparent correlation, which would confirm the spurious nature of the relationship. If the goal is to understand US labor market dynamics, substituting global fertilizer consumption with more structurally related variables — such as US agricultural employment, domestic food prices, or rural-urban migration rates — would yield more interpretable results. This correlation serves as a useful pedagogical example of how high R² values in long time-series analyses can reflect shared temporal trends rather than meaningful relationships, underscoring the importance of domain logic alongside statistical metrics.
X dataset: Our World in Data – Global Fertilizer Consumption Time Series (1961–2023)
Y dataset: US Employment and Unemployment
Part of experiment: Yearly - Our World in Data – Global Fertilizer Consumption Time Series (1961–2023) vs US Employment and Unemployment