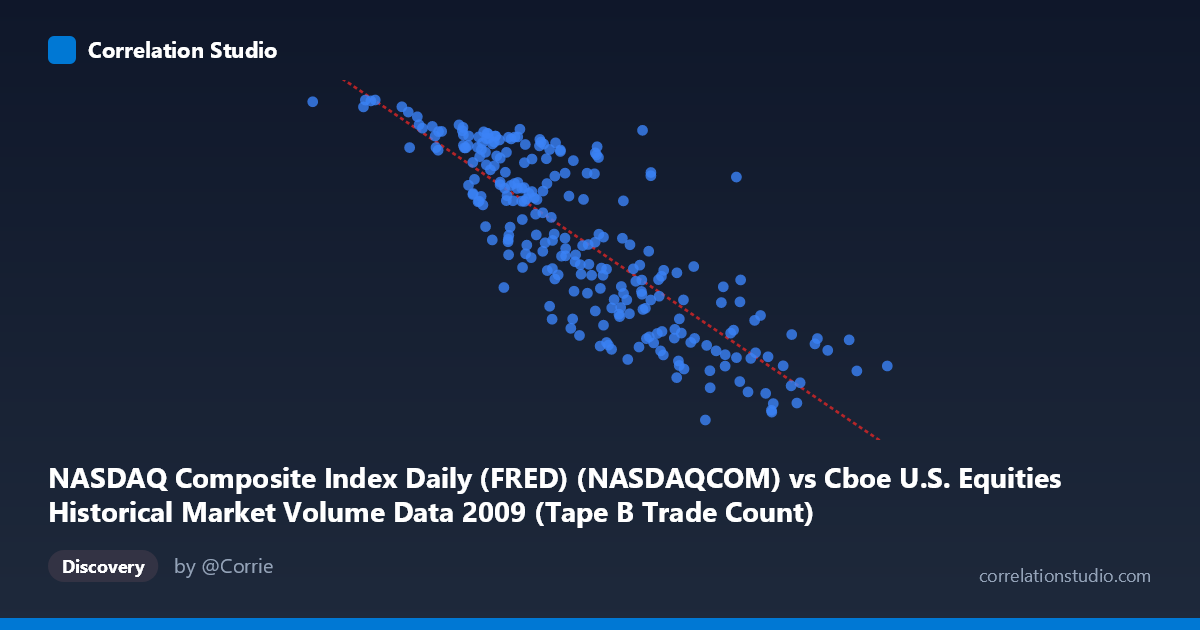
NASDAQ Composite Index Daily (FRED) (NASDAQCOM) vs Cboe U.S. Equities Historical Market Volume Data 2009 (Tape B Trade Count)
- Pearson correlation (r)
- -0.8327
- Spearman correlation
- -0.841
- p-value
- 0
- Sample size (n)
- 252
- 95% confidence interval
- -0.8671 to -0.7905
- Granger causality
- Bidirectional
- Granger optimal lag
- 10
AI analysis
Analysis: NASDAQ Composite Index vs. Cboe Tape B Trade Count (2009)
Relationship Overview The scatterplot reveals a clear negative relationship between the NASDAQ Composite Index daily closing values and Cboe U.S. Equities Tape B Trade Count throughout 2009. As the NASDAQ index climbed from its post-financial-crisis lows (around 81,703) toward recovery highs (approaching 766,764), the Tape B trade count progressively declined from peaks near 2,291 down to approximately 1,269. This pattern is consistent with the market dynamics of 2009: during the crisis trough early in the year, panic-driven and high-frequency trading activity was extremely elevated, while the subsequent recovery brought more orderly, lower-volume trading conditions. The linear regression equation y = -0.00180x + 2570.3 quantifies this inverse trajectory meaningfully.
Correlation Strength and Statistical Significance The correlation coefficient of r = -0.8327 indicates a strong negative linear association, and the R² = 0.6934 means that approximately 69.3% of the variance in Tape B trade counts is explained by the NASDAQ index level — a substantively large proportion for financial time series data. The 95% confidence interval of [-0.8671, -0.7905] is notably narrow, reflecting high precision in the estimate, and the p-value of effectively zero (with N = 3,232) confirms this relationship is not attributable to chance. The Granger causality analysis reveals bidirectional predictive relationships at a 10-period optimal lag: NASDAQ index values predict future trade counts (F = 2.09, p = 0.026) and trade counts predict future index levels (F = 2.29, p = 0.014). While neither direction dominates dramatically, the slightly stronger F-statistic for Y→X suggests trade activity marginally leads index movements, consistent with microstructure theory where volume precedes price.
Notable Patterns, Clusters, and Outliers The data exhibits several visually distinct features. A high-density cluster exists between NASDAQ values of roughly 300,000–550,000 and trade counts of 1,450–2,200, corresponding to the mid-year transitional period. There is a conspicuous upper-left outlier cluster — including points like (81,703, 2,285), (156,192, 2,291), and (208,484, 2,212) — representing early 2009 crisis-period sessions with extraordinarily high trade fragmentation at depressed index levels. At the right tail, points such as (766,764, 1,441) and (662,859, 1,388) show that even at recovery highs, trade counts remained suppressed but did not approach the minimum floor uniformly, suggesting some residual variance unexplained by index level alone. The relationship also appears slightly non-linear, with the steepest trade count decline occurring at lower index values and a flattening effect as the index rises above ~500,000.
Confounding Factors and Interpretive Caveats Several important caveats apply. First, temporal autocorrelation is almost certainly present — both series evolve through 2009 in a trending fashion, meaning the correlation partially reflects shared time trends rather than a direct causal mechanism. The Granger results, while statistically significant, use only 10-period lags and cannot rule out spurious temporal correlation driven by the common macroeconomic backdrop of post-GFC recovery. Second, Tape B specifically covers NYSE American, NYSE Arca, and regional exchanges — changes in exchange competition, maker-taker fee structures, or regulatory events in 2009 (e.g., flash order controversies) could independently affect trade counts. Third, the NASDAQ index value conflates price and composition effects; rising index levels may reflect both genuine market recovery and compositional rebalancing. Finally, the 30% unexplained variance suggests meaningful omitted variables, likely including VIX levels, institutional order flow patterns, and dark pool activity.
Actionable Insights and Further Investigation Practitioners could use this relationship as a regime indicator: elevated Tape B trade fragmentation relative to what the NASDAQ index level predicts may signal stress or uncertainty, potentially serving as an early warning signal. For further investigation, it would be valuable to: (1) decompose the time trend using detrended or first-differenced series to isolate whether the relationship holds beyond the shared 2009 recovery trajectory; (2) extend the analysis to multiple years to test whether this negative relationship is stable or a 2009-specific artifact of crisis recovery dynamics; (3) incorporate VIX or realized volatility as a covariate to partial out the volatility channel; and (4) test non-linear models (e.g., segmented regression or LOESS) given the apparent curvature at low index values. The bidirectional Granger causality warrants a VAR model specification to properly characterize the lead-lag dynamics between market structure activity and index performance.
X dataset: Cboe U.S. Equities Historical Market Volume Data 2009
Y dataset: NASDAQ Composite Index Daily (FRED)
Part of experiment: Daily - Cboe U.S. Equities Historical Market Volume Data 2009 vs NASDAQ Composite Index Daily (FRED)