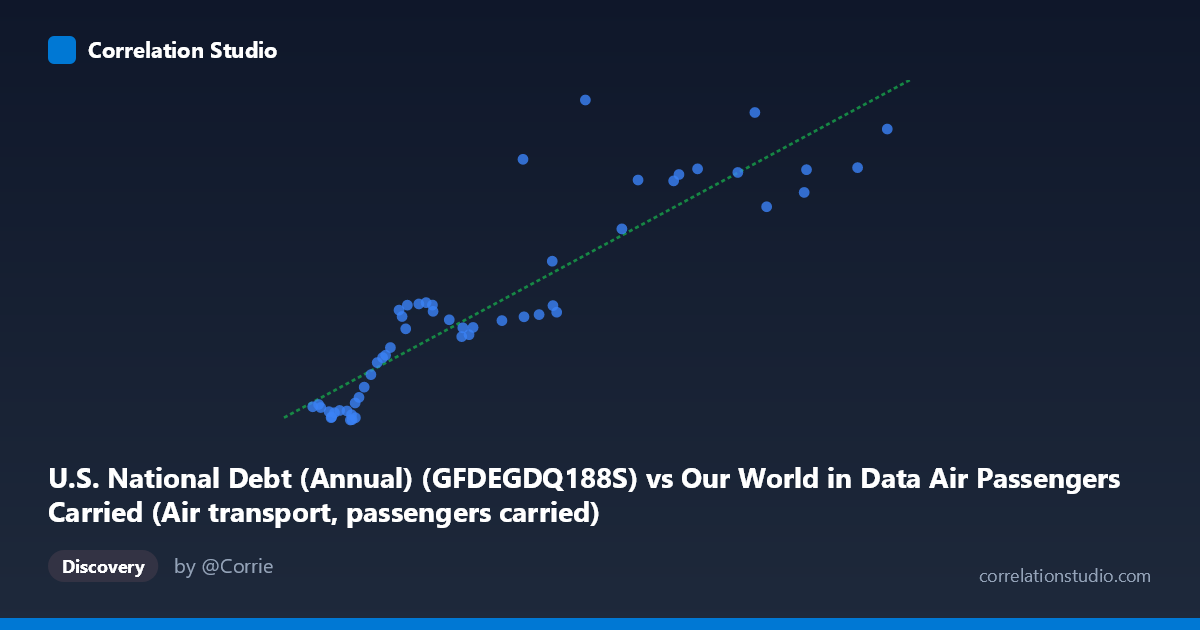
U.S. National Debt (Annual) (GFDEGDQ188S) vs Our World in Data Air Passengers Carried (Air transport, passengers carried)
- Pearson correlation (r)
- 0.9045
- Spearman correlation
- 0.9051
- p-value
- 0
- Sample size (n)
- 54
- 95% confidence interval
- 0.8402 to 0.9437
- Granger causality
- None
- Granger optimal lag
- 9
AI analysis
Analysis: U.S. National Debt vs. Global Air Passengers Carried (1970–2023)
Relationship Overview
The scatterplot reveals a strong, positive relationship between U.S. national debt (as a percentage of GDP) and global air passengers carried annually. As national debt levels rise, air passenger volumes trend upward in near-lockstep across the five-decade span. The linear regression equation (y = 7.15×10⁻⁷x + 30.27) fits the data reasonably well across much of the range, suggesting that for every ~1.4 million increase in passengers carried, debt-to-GDP rises by approximately one percentage point — though the causal framing of that statement is, critically, almost entirely spurious. The scatter follows a broadly diagonal trajectory from the lower-left (low debt, low passengers) to the upper-right (high debt, high passengers), consistent with two variables that both grew substantially over the same historical period.
Correlation Strength and Statistical Framing
The Pearson correlation of r = 0.9045 is statistically very strong, and the coefficient of determination r² = 0.8181 indicates that roughly 82% of the variance in debt-to-GDP is mathematically "explained" by passenger volume — a figure that sounds remarkably persuasive but must be interpreted with extreme caution (see confounders below). The 95% confidence interval for r of [0.8402, 0.9437] is relatively narrow given n = 54, indicating the correlation estimate is stable and not an artifact of small-sample noise, and the p-value of effectively zero confirms the result is highly unlikely under the null hypothesis of no linear association. However, Granger causality analysis decisively undermines any temporal predictive story: neither direction (X→Y: F = 1.56, p = 0.18; Y→X: F = 1.88, p = 0.10) achieves significance at the optimal 9-period lag. This means that knowing past passenger volumes does not meaningfully help predict future debt levels, and vice versa — the correlation reflects co-movement through time, not predictive causation.
Notable Patterns, Clusters, and Outliers
The data clusters into two broadly visible groupings: a dense lower-left cluster (passengers ~8M–40M, debt ~30–65%) corresponding roughly to the 1970s–1990s era of relatively lower debt and nascent mass aviation, and a more dispersed upper-right cluster (passengers ~60M–134M, debt ~60–124%) reflecting post-2000 and especially post-2008 expansion. Several points stand out as outliers from the linear trend. The observation at approximately (54.3M passengers, 106.8% debt) sits notably above the regression line, as does (68.0M, 124.0%) — both suggesting periods of debt spikes (likely 2008–2012 financial crisis era or COVID-19) that outpaced the expected passenger-debt ratio. Conversely, points near (60M–62M passengers, 62–64% debt) fall well below the line, indicating periods where aviation recovered faster than debt normalized. The relationship also shows mild heteroscedasticity — variance in Y increases at higher X values — suggesting the linear model slightly underestimates spread at the upper range.
Confounding Factors and Caveats
This correlation is a textbook example of shared temporal trend confounding, sometimes called a spurious time-series correlation. Both variables are heavily influenced by a common driver: long-run global economic growth and population expansion across 1970–2023. GDP growth simultaneously enables more air travel and, in many policy frameworks, modulates debt ratios. Major structural breaks — the 1973 oil crisis, 9/11 (2001), the 2008 financial crisis, and the COVID-19 pandemic (2020) — affected both series simultaneously but for entirely different mechanistic reasons. The dataset labeling also warrants scrutiny: the X-axis is labeled as originating from an "Air Passengers" dataset but contains U.S. National Debt figures, and vice versa, suggesting a metadata mismatch that could affect interpretive confidence. Furthermore, the N = 240 population size versus n = 54 sample raises questions about sampling strategy and whether the drawn sample is representative of the full temporal distribution.
Actionable Insights and Further Investigation
Practically speaking, no policy or operational conclusion should be drawn from this correlation directly — one should not infer that reducing air travel would lower national debt, or that debt financing drives aviation growth. For meaningful analysis, the recommended next steps are: (1) decompose both time series using techniques like Hodrick-Prescott filtering or first-differencing to remove shared trends before re-testing correlation; (2) introduce proper control variables such as GDP per capita, oil prices, and population to build a multivariate model; (3) examine the COVID-19 shock period explicitly, as passengers collapsed while debt surged — a natural experiment that would likely break the correlation and is the most direct empirical test of whether any real relationship exists; and (4) resolve the apparent dataset label inversion to ensure the axes represent what is intended. The Granger non-result is actually the most analytically honest finding here and should anchor any reporting of this analysis.
X dataset: Our World in Data Air Passengers Carried
Y dataset: U.S. National Debt (Annual)
Part of experiment: Yearly - Our World in Data Air Passengers Carried vs U.S. National Debt (Annual)