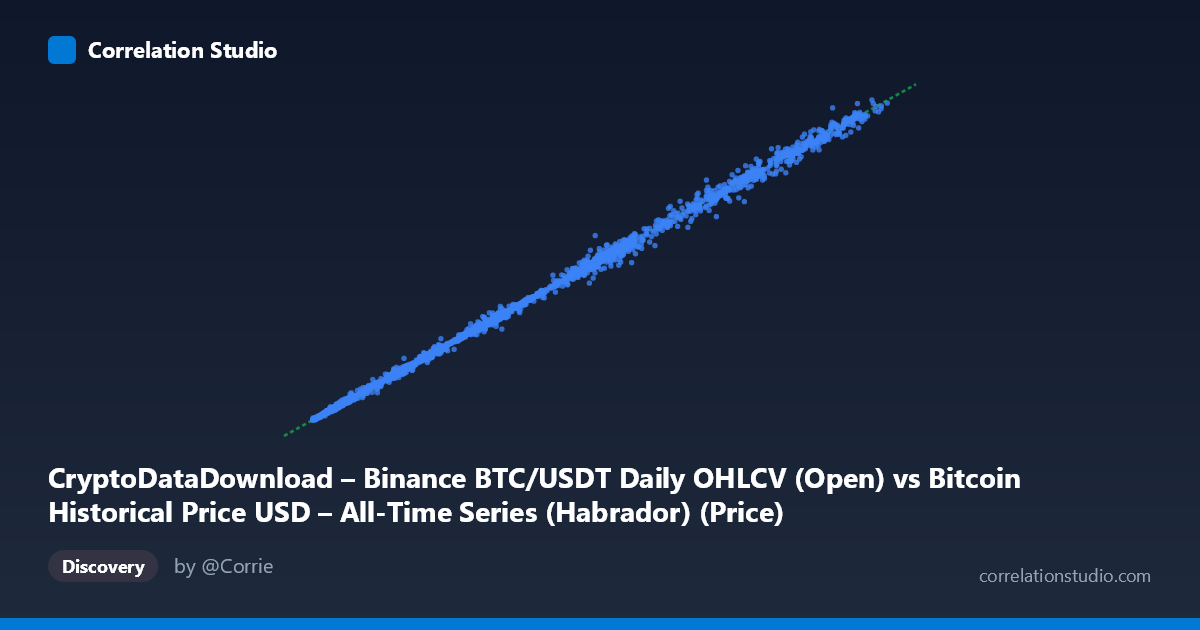
CryptoDataDownload – Binance BTC/USDT Daily OHLCV (Open) vs Bitcoin Historical Price USD – All-Time Series (Habrador) (Price)
- Pearson correlation (r)
- 0.9994
- Spearman correlation
- 0.9994
- p-value
- 0
- Sample size (n)
- 3169
- 95% confidence interval
- 0.9994 to 0.9994
- Granger causality
- None
- Granger optimal lag
- 10
AI analysis
Analysis: Bitcoin Open Price (Habrador) vs. BTC/USDT Open Price (Binance)
1. What the Visualization Reveals
This scatterplot compares Bitcoin's opening price from two different data sources — a general historical price series (Habrador) and Binance's BTC/USDT daily OHLCV data — over the same underlying dates. The points fall almost perfectly along a straight line with slope ≈1 and near-zero intercept (y = 0.998437x + 23.12), indicating these two series are measuring essentially the same underlying quantity: Bitcoin's daily opening price in USD. The relationship holds consistently across the entire price range, from ~$3,200 to ~$124,700, spanning multiple market cycles.
2. Strength, Direction, and Uncertainty
The correlation is essentially as strong as empirical data gets: r = 0.9994, r² = 0.9988. This means 99.88% of the variance in one series is explained by the other — the two datasets are near-duplicates rather than independently varying signals. The 95% confidence interval [0.9994, 0.9994] is vanishingly narrow given the large sample (n=3,169), and p ≈ 0 confirms this relationship is not due to chance. However, the Granger causality test found no significant predictive direction in either direction (X→Y: p=0.82; Y→X: p=0.83). This is expected and important to interpret correctly: Granger causality tests whether past values of one series predict future values of the other beyond what the series' own history predicts. Since both series track the same contemporaneous price at the same timestamps, there's no lead-lag structure to detect — they move together instantaneously, not sequentially.
3. Notable Patterns and Features
The scatter is remarkably tight and linear across all magnitudes, with no visible curvature, heteroscedasticity, or regime breaks — a log-log or log-linear pattern often seen in financial data is absent because both axes already scale together (BTC price vs. BTC price). Minor deviations appear as small vertical/horizontal scatter around the line, particularly at lower price levels (e.g., pairs like 39,521.90 vs. 42,158.85, or 69,702 vs. 71,280), where percentage discrepancies are more visible even if absolute differences are similar. These likely reflect timestamp misalignment, exchange-specific pricing (Binance vs. aggregated/other-exchange data), or minor date-boundary mismatches (UTC cutoff differences) between the two data providers. No clear outlier cluster or structural break is evident.
4. Confounding Factors and Caveats
The near-unity relationship is not surprising or economically meaningful in the traditional sense — this isn't two independent variables correlating due to a shared driver; it's two overlapping measurements of the identical asset price, likely differing only by exchange source, aggregation methodology, or minor timestamp alignment. The lack of Granger causality shouldn't be read as "no relationship" — it simply reflects that same-day pricing has no lag structure to exploit. A key caveat: N (3,212) vs. n (3,169) indicates ~43 unmatched/missing observations, which could introduce selection effects if missingness correlates with volatile periods (e.g., exchange outages, data gaps during flash crashes).
5. Actionable Insights
Given the extremely high r² and slope ≈1, these two series should be treated as substitutable proxies for BTC price, not as distinct signals for portfolio diversification or predictive modeling — using both in a model would introduce severe multicollinearity. Further investigation should focus on residual analysis: examining where deviations from y=x are largest (likely during high-volatility days) to assess data quality, exchange-specific slippage, or timestamp/timezone alignment issues between Habrador's aggregated series and Binance's native feed. If the goal is arbitrage or data-quality auditing, the residuals (y − 0.998437x − 23.12) — rather than the correlation itself — are the more informative object of study.
X dataset: Bitcoin Historical Price USD – All-Time Series (Habrador)
Y dataset: CryptoDataDownload – Binance BTC/USDT Daily OHLCV
Part of experiment: Bitcoin - Bitcoin Historical Price USD – All-Time Series (Habrador) vs CryptoDataDownload – Binance BTC/USDT Daily OHLCV