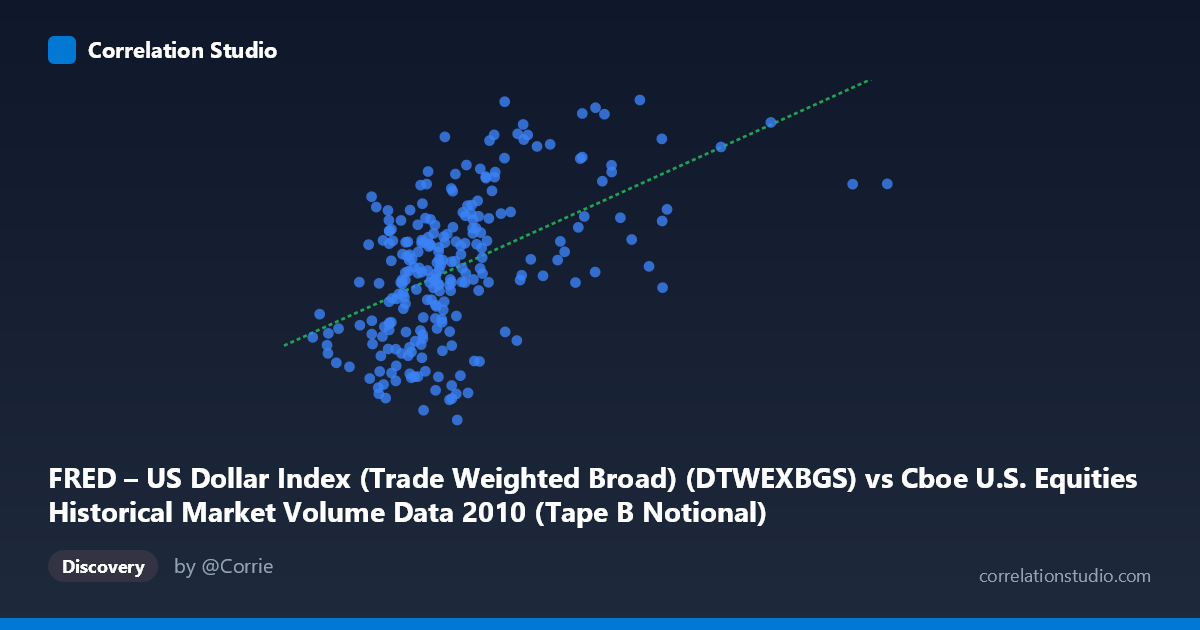
FRED – US Dollar Index (Trade Weighted Broad) (DTWEXBGS) vs Cboe U.S. Equities Historical Market Volume Data 2010 (Tape B Notional)
- Pearson correlation (r)
- 0.5225
- Spearman correlation
- 0.5205
- p-value
- 0
- Sample size (n)
- 245
- 95% confidence interval
- 0.425 to 0.608
- Granger causality
- None
- Granger optimal lag
- 1
AI analysis
Scatterplot Analysis: US Dollar Index vs. Cboe Tape B Notional Volume (2010)
Relationship Overview
The scatterplot reveals a positive relationship between the US Dollar Index (Trade Weighted Broad) on the X-axis and Cboe Tape B Notional trading volume on the Y-axis across 245 trading days in 2010. As the dollar index increases, Tape B notional volume tends to rise as well. The linear regression equation (y = 4.86×10⁻¹⁰x + 90.54) reflects a very shallow slope given the enormous scale of the X-axis values (ranging from ~1.6 to ~16.0 billion), meaning that practically speaking, very large changes in the dollar index correspond to only modest incremental changes in the notional volume metric. The relationship, while statistically discernible, is far from deterministic in appearance.
Correlation Strength and Statistical Framing
The Pearson correlation of r = 0.5225 indicates a moderate positive association, but the coefficient of determination (R² = 0.2730) is the more sobering figure: only 27.3% of the variance in Tape B notional volume is explained by movements in the dollar index. This leaves nearly three-quarters of the variation unexplained by this single predictor. The 95% confidence interval for r [0.4250, 0.6080] is reasonably tight and does not cross zero, and with p ≈ 0 across a population of N = 3,302, the correlation is statistically robust — this is not a spurious finding driven by small sample noise. However, the Granger causality results complicate the narrative significantly: neither direction achieves conventional significance (X→Y: F = 0.33, p = 0.57; Y→X: F = 2.83, p = 0.09). This means that neither variable reliably predicts the other's future values at the tested lag, so while the two series move together contemporaneously to some degree, there is no evidence of a temporal predictive or directional causal mechanism between them.
Notable Patterns, Clusters, and Outliers
Several features stand out visually. There is a dense cluster of points concentrated in the X range of roughly 3–6 billion, where Y values span approximately 89–95, suggesting the bulk of trading days occupy a relatively compressed band of both dollar index values and notional volume. Above X ≈ 8 billion, the data becomes sparser but several high-leverage points pull the regression line upward — notably observations near (9.78B, 97.55), (8.68B, 97.34), (6.41B, 97.50), and (8.90B, 97.17), which show very elevated Tape B volumes coinciding with high dollar index readings. Conversely, a few points such as (5.49B, 89.71) and (3.25B, 89.85) sit notably below the regression line, suggesting occasional low-volume days even at moderate dollar levels. The right tail of the X distribution appears to drive much of the observed correlation, raising questions about whether the relationship holds uniformly or is largely an artifact of extreme observations.
Confounding Factors and Interpretive Caveats
Several important caveats deserve attention. First, axis labeling appears to be swapped based on the metadata: the X-axis is labeled as the Dollar Index yet carries values in the billions (consistent with notional volume), while the Y-axis carries values in the 89–97 range (consistent with a dollar index reading). This warrants careful verification before drawing conclusions. Second, even accepting the correlation at face value, 2010 was a specific macroeconomic environment — post-financial-crisis recovery, Federal Reserve quantitative easing, and European sovereign debt stress — all of which could simultaneously drive both dollar strength and equity trading volumes, acting as common confounders rather than evidence of a direct link. Third, notional volume is influenced by price levels, volatility regimes, and market structure changes that are largely orthogonal to currency dynamics. The lack of Granger causality strongly suggests any co-movement is driven by shared external factors rather than a structural link between these two variables.
Actionable Insights and Further Investigation
Given the moderate correlation but absence of temporal predictability, practitioners should not use the dollar index as a leading indicator for Tape B notional volume (or vice versa) in tactical trading or market operations decisions. However, the co-movement does suggest both series respond to common macro drivers worth identifying — volatility indices (VIX), Federal Reserve policy announcements, or risk-on/risk-off regime shifts would be logical candidates to test as mediating or confounding variables. A multiple regression or factor model incorporating macro controls could clarify whether the dollar-volume relationship survives conditioning on broader market conditions. Extending the analysis across multiple years beyond 2010 would test whether this correlation is structurally persistent or an artifact of that specific post-crisis year. Finally, examining whether the relationship is non-linear (e.g., threshold effects at extreme dollar levels) and performing rolling-window correlation analysis to detect time-varying relationships would add meaningful depth to this investigation.
X dataset: Cboe U.S. Equities Historical Market Volume Data 2010
Y dataset: FRED – US Dollar Index (Trade Weighted Broad)
Part of experiment: Daily - Cboe U.S. Equities Historical Market Volume Data 2010 vs FRED – US Dollar Index (Trade Weighted Broad)