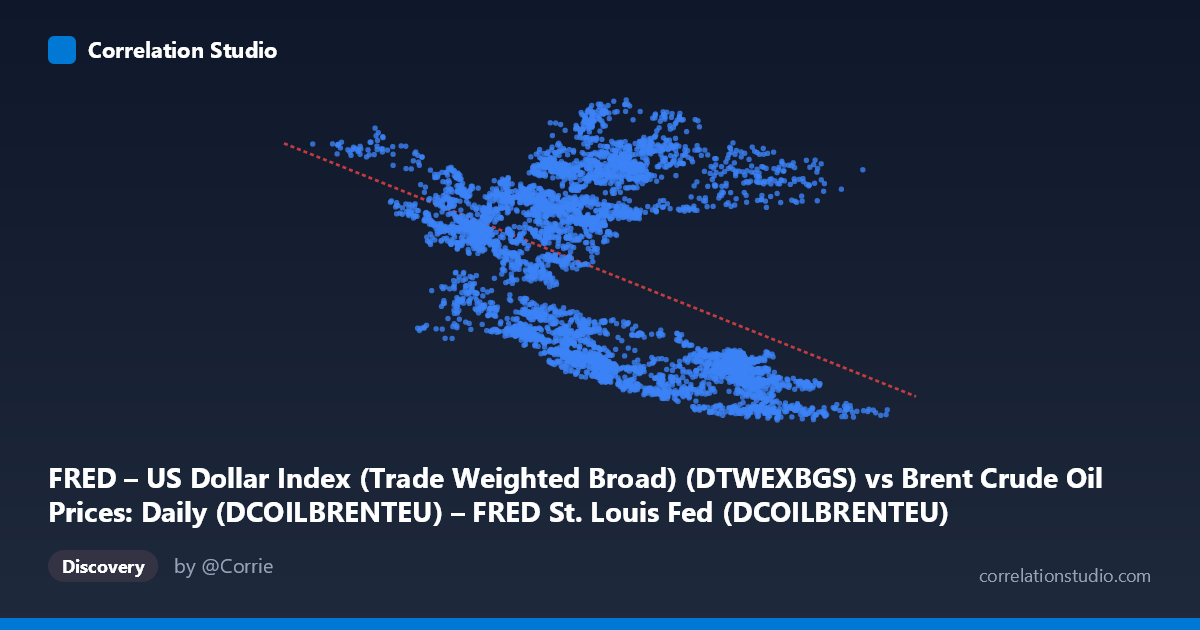
FRED – US Dollar Index (Trade Weighted Broad) (DTWEXBGS) vs Brent Crude Oil Prices: Daily (DCOILBRENTEU) – FRED St. Louis Fed (DCOILBRENTEU)
- Pearson correlation (r)
- -0.4595
- Spearman correlation
- -0.3941
- p-value
- 0
- Sample size (n)
- 5021
- 95% confidence interval
- -0.481 to -0.4374
- Granger causality
- None
- Granger optimal lag
- 1
AI analysis
US Dollar Index vs. Brent Crude Oil Price: Correlation Analysis
Relationship Overview
The scatterplot reveals a moderate negative relationship between the Trade-Weighted Broad US Dollar Index (X-axis) and Brent Crude Oil prices (Y-axis), captured across nearly 5,000 daily observations spanning 2006–2026. The linear regression equation (y = -0.238x + 124.6) confirms the inverse dynamic: as the dollar strengthens, oil prices tend to fall, and vice versa. This is economically intuitive — since crude oil is globally priced in USD, a stronger dollar makes oil more expensive for foreign buyers, suppressing demand and prices, while a weaker dollar does the opposite. The scatter, however, is visibly wide, immediately signaling that this relationship is real but far from deterministic.
Correlation Strength and Statistical Significance
The Pearson correlation of r = -0.46 indicates a moderate negative association. Crucially, the R² of 0.211 means the dollar index explains only about 21% of the variance in Brent crude prices — leaving roughly 79% of price variation unexplained by this single variable alone. The 95% confidence interval of [-0.481, -0.437] is narrow given the large paired sample (n = 5,021), and the p-value of effectively zero confirms the relationship is highly statistically significant and not a sampling artifact. Despite this statistical robustness, the Granger causality tests tell a more sobering story: neither direction (X→Y: F=0.13, p=0.72; Y→X: F=1.30, p=0.25) achieves significance at the optimal 1-period lag. This means that, at a daily frequency, neither variable reliably predicts the other's next-day movement — the correlation reflects a contemporaneous structural relationship rather than a leading/lagging one useful for short-term forecasting.
Notable Patterns and Structural Features
Several distinct clusters are visible in the sample points. A dense cluster of high-X, low-Y observations (dollar index ~105–135, oil ~86–94) suggests periods of dollar strength coinciding with depressed oil prices — likely reflecting post-2022 Fed tightening cycles. A separate cluster of low-X, high-Y points (dollar index ~40–75, oil ~110–130) captures the weak-dollar, high-oil-price era of the mid-2000s to 2014 supercycle. Notably, a group of points near X ~70–80 shows substantial vertical spread in Y (~90 to ~128), indicating considerable oil price variability even at similar dollar index levels — consistent with the modest R². A few potential outliers appear in the mid-range of X (~113–114) with unusually high Y values (~120–122), possibly capturing geopolitical supply shocks (e.g., Russia-Ukraine 2022 price spike) that temporarily decoupled the typical relationship.
Confounding Factors and Caveats
Several important caveats limit causal interpretation. First, omitted variable bias is substantial — oil prices are simultaneously driven by OPEC production decisions, geopolitical risk premia, global demand cycles, inventory levels, and speculative positioning, none of which are captured here. Second, the relationship is likely non-stationary: the dollar-oil linkage has varied across regimes (petrodollar recycling dynamics, US shale emergence, COVID demand collapse), meaning a single linear fit across 20 years may obscure structural breaks. Third, while the data span 2006–2026, the axes appear reversed from convention in the dataset labeling (X is described as the dollar index but sourced from the Brent dataset and vice versa) — analysts should verify column mapping before drawing operational conclusions. Finally, daily frequency noise likely suppresses any Granger signal that might emerge at weekly or monthly aggregation.
Actionable Insights and Further Investigation
Given that 79% of oil price variance remains unexplained, practitioners should treat the dollar index as one input in a multivariate oil price model rather than a standalone predictor. Recommended next steps include: (1) Re-run Granger causality at weekly and monthly lags, where structural macro relationships typically become more detectable; (2) Segment the data by regime (pre/post-2014 shale revolution, pre/post-COVID, pre/post-2022 tightening cycle) to test whether the correlation strengthens or reverses across periods; (3) Add OPEC supply variables and global PMI data as covariates to isolate the dollar's marginal explanatory contribution; and (4) Test for non-linear threshold effects — the relationship may be asymmetric, with dollar strength mattering more during risk-off periods. For FX or commodity risk managers, this correlation is a useful hedge signal over multi-month horizons but should not be relied upon for daily tactical positioning given the absent Granger predictability.
X dataset: Brent Crude Oil Prices: Daily (DCOILBRENTEU) – FRED St. Louis Fed
Y dataset: FRED – US Dollar Index (Trade Weighted Broad)
Part of experiment: Daily - Brent Crude Oil Prices: Daily (DCOILBRENTEU) – FRED St. Louis Fed vs FRED – US Dollar Index (Trade Weighted Broad)