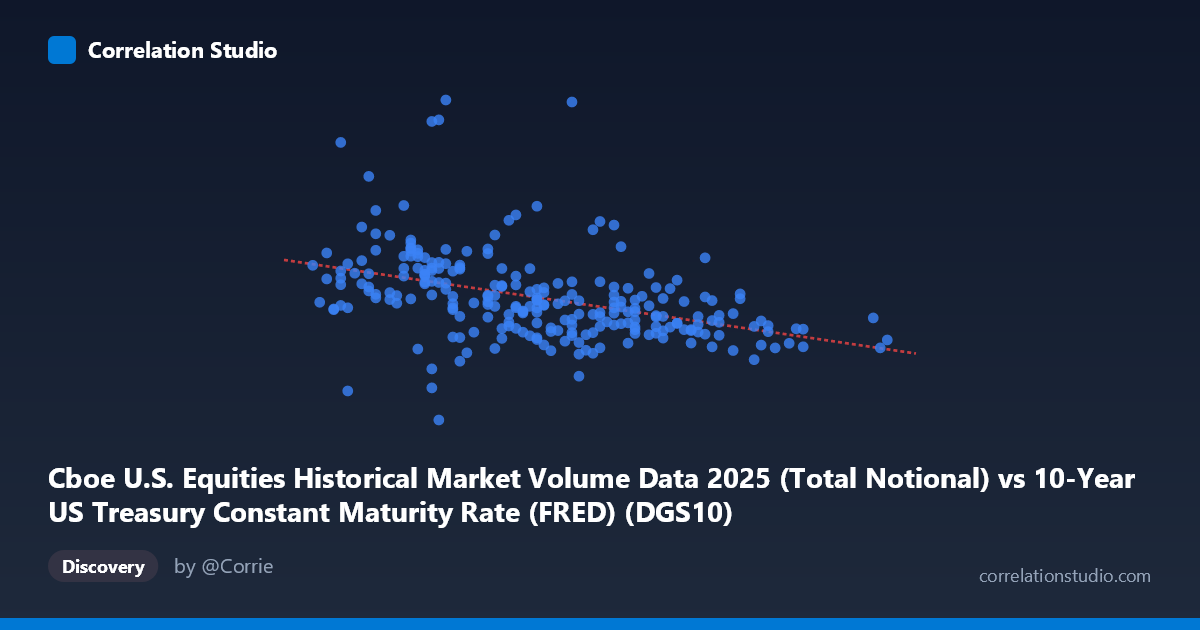
Cboe U.S. Equities Historical Market Volume Data 2025 (Total Notional) vs 10-Year US Treasury Constant Maturity Rate (FRED) (DGS10)
- Pearson correlation (r)
- -0.4165
- Spearman correlation
- -0.5247
- p-value
- 0
- Sample size (n)
- 248
- 95% confidence interval
- -0.5144 to -0.3079
- Granger causality
- None
- Granger optimal lag
- 10
AI analysis
Analysis of 10-Year Treasury Yield vs. Cboe Equity Market Volume (2025)
1. Overall Relationship Pattern The scatterplot reveals a moderate negative relationship between the 10-year US Treasury constant maturity rate (X-axis) and total notional equity trading volume on Cboe exchanges (Y-axis). As Treasury yields rise, equity market notional volume tends to decline, and vice versa. The linear regression equation (y = -2.15×10¹⁰x + 1.35×10¹¹) quantifies this inverse slope, suggesting that each 1 percentage point increase in the 10-year yield is associated with approximately $21.5 billion in reduced notional trading volume. However, the data cloud is visibly wide and dispersed, indicating that this relationship is real but far from deterministic — many observations deviate substantially from the regression line.
2. Correlation Strength, Direction, and Temporal Causality The Pearson correlation of r = -0.4165 reflects a moderate negative association, but the more telling statistic is r² = 0.1734, meaning that Treasury yield levels explain only 17.3% of the variance in equity notional volume. Over 82% of volume variation is driven by other factors entirely. The 95% confidence interval for r of [-0.51, -0.31] is reasonably tight and excludes zero, and the p-value of 7.99×10⁻¹² confirms this correlation is highly statistically significant — not a sampling artifact. Importantly, however, the Granger causality tests show no significant predictive directionality in either direction (X→Y: F=0.995, p=0.449; Y→X: F=0.616, p=0.800). This means that knowing today's yield does not meaningfully improve forecasts of tomorrow's volume, and knowing today's volume does not help predict tomorrow's yield. The correlation is real cross-sectionally, but neither variable temporally "leads" the other in a statistically meaningful way.
3. Notable Patterns, Clusters, and Outliers Several features stand out in the sample data. There is a visible cluster of high-volume observations ($50B notional) concentrated in the lower yield range (approximately 4.00–4.20%), consistent with the negative correlation. Conversely, the highest yield readings (4.60–4.79%) are almost exclusively associated with lower volumes in the $30–43B range. At least one point — (4.15, $17.48B) — appears to be a notable downside outlier, sitting far below the expected volume for that yield level and likely representing an anomalous low-activity trading day (holiday-adjacent session or data irregularity). The Spearman ρ exceeding Pearson r is also a meaningful diagnostic: it suggests the relationship is better described as monotonic but non-linear, meaning a logarithmic or polynomial fit would likely capture the true pattern more accurately than the linear model fitted here.
4. Confounding Factors and Interpretive Caveats Several confounds complicate causal interpretation. First, both variables are jointly driven by macroeconomic regime shifts — periods of Federal Reserve tightening, for instance, simultaneously push yields higher and may reduce risk appetite and equity market activity, creating a spurious-looking but structurally mediated relationship. Second, day-of-week and calendar effects (month-end, quarter-end, holidays) heavily influence trading volume and are unrelated to yield levels, contributing substantial noise. Third, the dataset covers only 2025, a single calendar year with a relatively narrow yield range (3.97–4.79%), which limits generalizability. Fourth, notional volume is influenced by equity price levels themselves — if equities are more expensive, the same number of shares traded generates higher notional value regardless of yield conditions. Finally, the lack of Granger causality at the 10-lag optimal horizon suggests any observed co-movement may reflect contemporaneous reaction to shared macro news rather than any lead-lag dynamic.
5. Actionable Insights and Further Investigation Given the moderate but incomplete explanatory power and absent Granger causality, several follow-up analyses are warranted. A polynomial or logarithmic regression should be tested, given the Spearman-Pearson divergence, to better characterize the non-linear structure. Researchers should control for VIX (implied volatility), equity price index levels, and Fed announcement days, which likely absorb much of the unexplained variance. Regime segmentation — splitting the data into rising vs. falling yield sub-periods — may reveal asymmetric relationships. Examining trade count and average trade size separately (both available in the Cboe dataset) would help determine whether volume changes are driven by participation breadth or ticket size. Finally, extending the analysis to prior years in the Cboe multi-year series would test whether this negative correlation is a stable structural feature or an artifact of 2025's specific macroeconomic environment.
X dataset: 10-Year US Treasury Constant Maturity Rate (FRED)
Y dataset: Cboe U.S. Equities Historical Market Volume Data 2025
Part of experiment: Daily - 10-Year US Treasury Constant Maturity Rate (FRED) vs Cboe U.S. Equities Historical Market Volume Data 2025