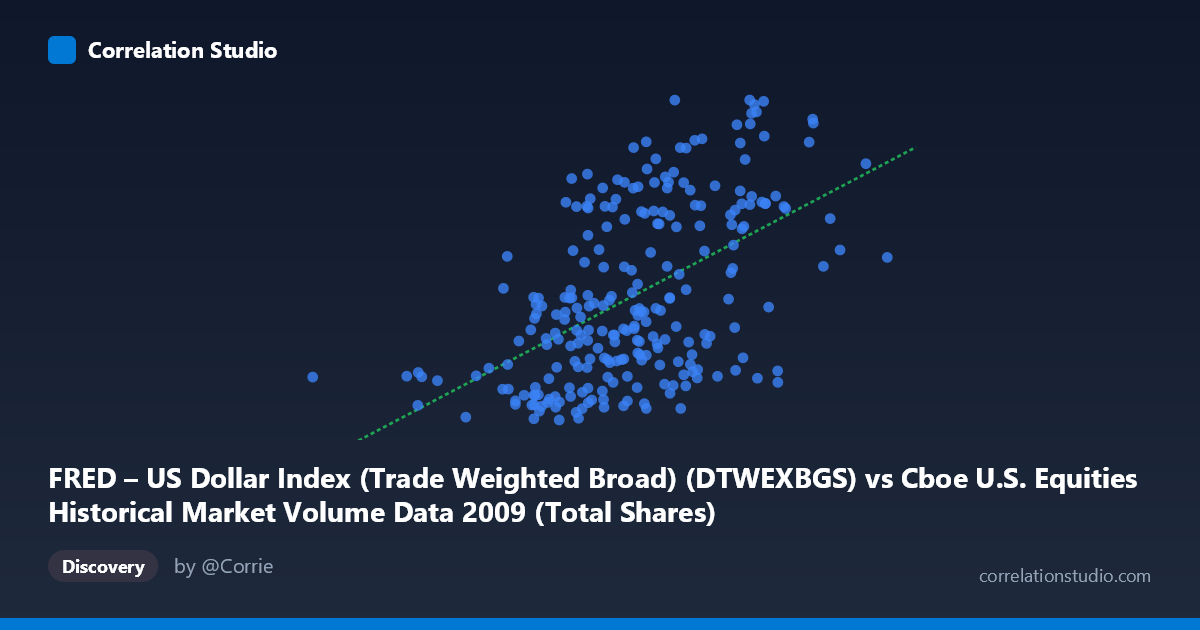
FRED – US Dollar Index (Trade Weighted Broad) (DTWEXBGS) vs Cboe U.S. Equities Historical Market Volume Data 2009 (Total Shares)
- Pearson correlation (r)
- 0.5271
- Spearman correlation
- 0.5113
- p-value
- 0
- Sample size (n)
- 248
- 95% confidence interval
- 0.4309 to 0.6116
- Granger causality
- None
- Granger optimal lag
- 1
AI analysis
Scatterplot Analysis: US Dollar Index vs. Cboe US Equities Market Volume (2009)
Relationship Overview
The scatterplot reveals a moderate positive relationship between the Trade Weighted Broad US Dollar Index (X-axis) and Total Shares traded on Cboe US Equities markets (Y-axis) across 248 trading days in 2009. As equity market volume increases, the dollar index tends to trend higher, though the relationship is far from deterministic. The linear regression equation (y = 1.407×10⁻⁸x + 86.007) confirms the positive slope, and the scatter of points around the regression line visually reinforces that while a trend exists, substantial unexplained variation remains. This pairing is somewhat unconventional — dollar strength and equity volume are not typically analyzed in direct correlation — making the moderate association noteworthy for 2009 specifically, a year marked by extreme post-crisis market dynamics.
Correlation Strength, Direction, and Statistical Significance
With r = 0.527, the correlation is moderate and positive, but the r² value of 0.278 means only ~27.8% of the variance in the Dollar Index is explained by equity trading volume (or vice versa), leaving approximately 72% attributable to other forces. The 95% confidence interval for r of [0.431, 0.612] is reasonably tight given n=248, suggesting the estimate is stable and would likely replicate in similar samples. The p-value of effectively zero confirms this is highly unlikely to be a chance finding at this sample size. However, the Granger causality results tell a critically important story: neither direction (X→Y: F=0.408, p=0.523; Y→X: F=0.016, p=0.899) achieves statistical significance at any conventional threshold. This means that despite the meaningful contemporaneous correlation, neither variable temporally predicts the other at a one-period lag — ruling out straightforward lead-lag trading strategies and cautioning against causal interpretations of the correlation coefficient alone.
Notable Patterns, Clusters, and Outliers
Several structural features are visible in the data. There appears to be a broad central cluster of points roughly between volume values of 600M–900M (X-axis) and dollar index values of 91–104, forming the core of the positive trend. At the lower volume extreme, points near 192M–530M in volume tend to cluster at lower dollar index values (~90–97), while the high-volume tail (980M–1,212M) is associated with higher index readings (~100–106), driving the positive slope. Notable potential outliers include the point near (192,269,942, 92.87) — an unusually low-volume day far from the cluster — and high-volume readings above 1,050M paired with dollar values exceeding 103, which may reflect specific crisis-period trading sessions. There also appears to be heteroscedasticity: variance in the dollar index seems broader at mid-range volume levels and somewhat compressed at extremes, which could modestly violate linear regression assumptions.
Confounding Factors and Interpretive Caveats
The 2009 context is critical and potentially dominates this entire correlation. This was the year of the post-financial-crisis recovery, during which equity markets bottomed in March and rallied sharply while the dollar experienced its own crisis-driven volatility. Both variables may be jointly driven by a third factor — systemic risk/risk appetite — rather than causally linked to each other. When risk aversion was extreme (early 2009), flight-to-safety dynamics could have simultaneously suppressed certain volume patterns and affected dollar levels; as risk appetite returned, both may have moved together. Additionally, the note that dataset labels appear swapped (X-axis description references Cboe data but is labeled as FRED, and vice versa) introduces interpretive risk and should be verified before drawing firm conclusions. The broad dollar index aggregates currency movements against many trading partners, adding noise not specific to equity market dynamics.
Actionable Insights and Further Investigation
Given the moderate correlation without Granger causality, the most productive next steps would include: (1) controlling for the VIX or credit spread as a common risk-sentiment proxy to test whether the correlation dissolves into a spurious shared relationship with risk appetite; (2) segmenting the data by pre/post-March 2009 market bottom to test whether the correlation is regime-dependent and driven primarily by the crisis period; (3) exploring non-linear models (e.g., spline or polynomial regression) given the possible heteroscedasticity and clustering visible in the chart; and (4) verifying the axis/dataset label alignment, as a swap would fundamentally change interpretation. Finally, extending the analysis to multiple years would help distinguish whether this 2009 relationship reflects a structural phenomenon or a crisis-specific artifact unlikely to generalize.
X dataset: Cboe U.S. Equities Historical Market Volume Data 2009
Y dataset: FRED – US Dollar Index (Trade Weighted Broad)
Part of experiment: Daily - Cboe U.S. Equities Historical Market Volume Data 2009 vs FRED – US Dollar Index (Trade Weighted Broad)