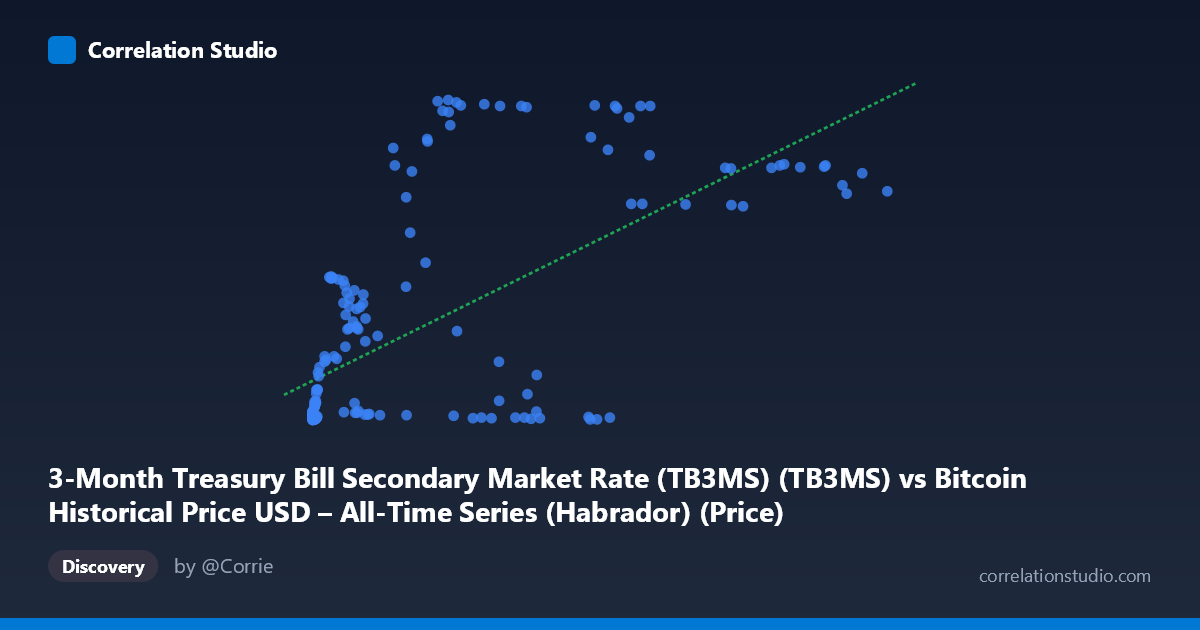
3-Month Treasury Bill Secondary Market Rate (TB3MS) (TB3MS) vs Bitcoin Historical Price USD – All-Time Series (Habrador) (Price)
- Pearson correlation (r)
- 0.649
- Spearman correlation
- 0.6431
- p-value
- 0
- Sample size (n)
- 189
- 95% confidence interval
- 0.5579 to 0.7246
- Granger causality
- Y → X
- Granger optimal lag
- 1
AI analysis
Analysis: Bitcoin Price vs. 3-Month Treasury Bill Rate
Note: the axis labels appear swapped in the metadata (X is described as TB3MS and Y as Bitcoin price, but the data ranges and regression clearly show X = Bitcoin price, ranging into the hundreds of thousands, and Y = T-bill rate, bounded between 0 and ~5.34%). This analysis proceeds using the actual data structure: X = Bitcoin price (USD), Y = 3-Month T-Bill rate (%).
1. What the Visualization Reveals
The scatterplot shows a positive, moderately strong association between Bitcoin's price level and the 3-month T-Bill rate. At low Bitcoin prices (under ~$1,000), Y values cluster tightly near zero to 0.5%, consistent with the near-zero interest rate environment of 2011–2015 and 2020–2021. As Bitcoin price rises into the tens of thousands, T-bill rates fan out dramatically — some high-price points still show near-zero rates (e.g., X=58,724, Y=0.02; X=41,869, Y=0.05), while others at similarly high prices show rates above 4% (e.g., X=97,365, Y=4.27; X=105,620, Y=4.23). This bifurcation suggests the relationship isn't a clean function of price alone but is time-dependent — high BTC prices coincide with both the ultra-low-rate 2020-21 bull run and the high-rate 2023-24 period.
2. Strength, Direction, and Statistical Confidence
The correlation (r = 0.649, r² = 0.421) indicates a moderate positive relationship, but only 42% of the variance in T-bill rates is explained by Bitcoin price — the majority (58%) is driven by other factors (primarily Fed monetary policy). The 95% CI [0.558, 0.725] is reasonably tight and excludes zero, and p ≈ 0 confirms the correlation is statistically robust, not a fluke of sampling. However, statistical significance here reflects a large, clearly non-random pattern rather than proof of a meaningful causal economic link. Critically, the Granger causality test shows Y (T-bill rate) leads X (Bitcoin price) at 1-period lag (F=4.58, p=0.034), while Bitcoin price shows no predictive power over rates (p=0.51). This is economically sensible: Fed policy (rates) influences risk-asset appetite and liquidity conditions, which subsequently affect Bitcoin valuations — not the reverse.
3. Notable Patterns and Outliers
Several features stand out: - Two-regime clustering: a dense low-price/low-rate cluster (X<2,000, Y<1) representing Bitcoin's early years, and a high-price cluster (X20,000) that splits into two rate sub-bands (~0.02–0.5 vs. ~4–5.3%). - Non-monotonic behavior: points like (44,354.64, 0.44) and (56,973.18, 0.06) show high prices with near-zero rates, while (27,983.75, 5.34) shows a moderate price with the sample's highest rate — indicating price alone doesn't linearly predict rate; the 2022-23 rate-hiking cycle occurred while BTC was well off its all-time highs. - Discontinuity/regime shift: the relationship looks more like two separate linear-ish clusters (pre-2022 and post-2022) than one continuous trend, which likely inflates the apparent linear r².
4. Confounding Factors and Caveats
This is a classic case of spurious/mediated correlation via time. Both series are trending macro time series over the same 2010–2026 window: T-bill rates reflect Fed policy cycles (ZIRP era → 2022-23 hiking cycle), while Bitcoin price reflects its own adoption/halving-driven appreciation. Any two time-trending series can show inflated correlation without direct causal linkage — a textbook case for spurious regression in non-stationary time series. The Granger result, while directionally interesting, is based on only n=189 with monthly aggregation and a single lag; it doesn't rule out both variables being driven by a common third factor (e.g., inflation, quantitative easing/tightening, general risk sentiment) rather than genuine rate→price causation.
5. Suggestions for Further Investigation
- Test stationarity (ADF/KPSS tests) and consider differencing or using returns/rate-changes rather than levels to avoid spurious-correlation artifacts. - Control for confounders like inflation (CPI), Fed balance sheet size, or equity market indices (S&P 500) in a multivariate regression to isolate BTC's sensitivity to rates specifically. - Segment by regime (ZIRP vs. hiking-cycle periods) and refit separately, since the pooled linear model likely averages over two structurally different relationships. - Extend Granger analysis with multiple lags and reverse-check with rate changes (ΔTB3MS) rather than levels, since markets typically react to rate changes/surprises rather than absolute levels. - Given the "risk-off" theoretical link (rising rates reduce speculative asset appetite), this data broadly supports monitoring Fed rate trajectory as a leading indicator for BTC market conditions — but treat the current r²=0.42 as a ceiling, not a precise forecasting tool.
X dataset: Bitcoin Historical Price USD – All-Time Series (Habrador)
Y dataset: 3-Month Treasury Bill Secondary Market Rate (TB3MS)
Part of experiment: Bitcoin - Bitcoin Historical Price USD – All-Time Series (Habrador) vs 3-Month Treasury Bill Secondary Market Rate (TB3MS)