Bitcoin Historical Data (2010-2024) (AssetCompletionTime) vs CryptoDataDownload – Binance BTC/USDT Daily OHLCV (Unix)
- Pearson correlation (r)
- 0.9386
- Spearman correlation
- 1
- p-value
- 0
- Sample size (n)
- 3191
- 95% confidence interval
- 0.9343 to 0.9426
- Granger causality
- None
- Granger optimal lag
- 10
AI analysis
Analysis of Bitcoin Timestamp Correlation Dataset
1. What the Visualization Reveals
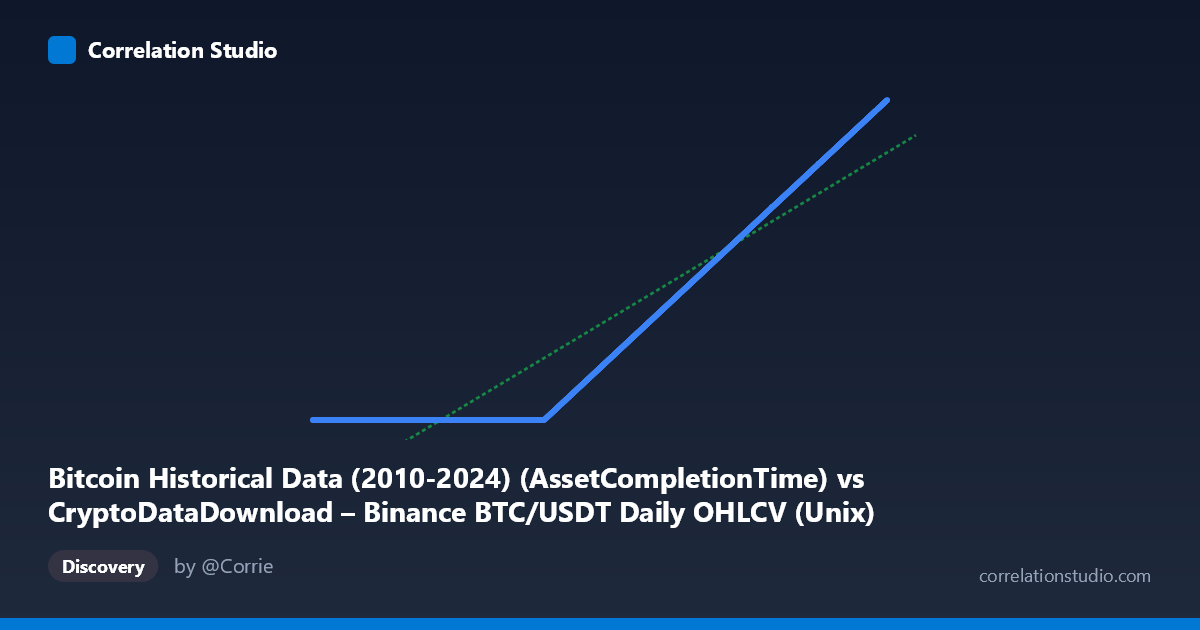
This scatterplot is comparing two timestamp columns that both purport to represent "AssetCompletionTime" or record time for BTC/USDT daily OHLCV data from Binance — essentially, two versions of the same underlying dataset's timestamp field. At a glance, the strong linear relationship (r = 0.94) suggests these are largely tracking the same clock, but the data reveals something more interesting: this is not a clean 1:1 mapping. A genuine duplicate timestamp field would produce r ≈ 1.0 with a slope of 1.0 and intercept of 0. Instead, we see a slope of 0.00064 and a massive intercept of ~609 million, indicating a unit mismatch and a data quality artifact, not a true measured relationship between independent variables.
2. Strength, Direction, and Confidence — with a Critical Caveat
The r² of 0.881 indicates 88% of variance in Y is "explained" by X, and the CI [0.934, 0.943] combined with p≈0 suggests this is highly statistically significant. However, this statistical strength is misleading given the data structure. Looking at the sample points, a large subset of Y-values are pinned at nearly identical values (~1,614,337,xxx) across wildly different X-values (spanning 2017–2022), while another subset shows Y ≈ X almost exactly (e.g., 1733616000000 → 1733712385). This bimodal pattern means the correlation is being driven largely by the subset where Y=X almost exactly (likely Y = X/1000, i.e., a unix-seconds vs. unix-milliseconds conversion), while a large cluster of "stuck" values is degrading the fit. The Granger causality results (p=0.91 and p=0.85, no significant lag relationship) confirm there is no meaningful temporal predictive relationship — reinforcing that this isn't two causally/economically linked variables, but rather two representations (one partially broken) of the same clock.
3. Notable Patterns and Outliers
The most striking feature is the flat "floor" cluster: many Y values sit at ~1,614,337,xxx (corresponding to a fixed date around Feb 26, 2021) regardless of X ranging from 2017 to 2022. This looks like a null/default/placeholder timestamp (e.g., a "record created" field that wasn't populated and defaulted to a fixed value, or a first-processing-run timestamp) rather than real data. Outside this cluster, points fall almost perfectly on a diagonal Y ≈ X/1000 line — consistent with X being in milliseconds and Y in seconds since epoch. This creates a distinctly non-linear, two-regime pattern: a flat horizontal band for early dates and a tight diagonal band for later dates (roughly post-2022), which a linear regression (forced through the whole dataset) badly misrepresents — hence the oddly small slope and huge intercept.
4. Confounding Factors and Caveats
The primary caveat: this is very likely a data pipeline/ETL artifact, not a genuine bivariate relationship between economic variables. Key concerns: - Unit inconsistency: X appears to be Unix milliseconds; Y appears to be Unix seconds — direct comparison without normalization is invalid. - Placeholder/default values: The repeated ~1,614,337,xxx values suggest missing-data imputation, a stale cache, or a "last updated" field capturing pipeline run-time rather than actual data timestamps. - Same source, not independent measurements: Both columns derive from Binance BTC/USDT OHLCV timestamps, so any "correlation" is tautological once the artifacts are removed. - Linear regression R² is being inflated/deflated by the two distinct regimes; a single linear model is not an appropriate description of this relationship.
5. Recommendations for Further Investigation
1. Normalize units first: Divide X by 1000 (or multiply Y by 1000) and re-run the comparison to test the hypothesis that this is simply the same timestamp in different units. 2. Isolate and investigate the flat cluster: Filter for Y ≈ 1,614,337,xxx and determine what date range/rows produce this — likely a data ingestion bug, backfill default, or NULL replacement that needs fixing at the source. 3. Segment the regression: Fit separate models pre- and post- the apparent breakpoint (~early 2022) rather than one global linear fit, since the current R²/slope are not meaningful across the full range. 4. Deduplicate/reconcile schema: Since both columns describe "AssetCompletionTime" for the same OHLCV feed, clarify whether one field should be deprecated, and audit the ETL job that populates the Y column for the stale-value bug. 5. Re-run Granger/correlation only after cleaning: Once timestamps are unified and placeholders removed, correlation/causality tests are largely moot (they'd trivially be r≈1) — the real analytical value is in data quality auditing, not causal inference, for this particular pair.
X dataset: CryptoDataDownload – Binance BTC/USDT Daily OHLCV
Y dataset: Bitcoin Historical Data (2010-2024)
Part of experiment: Bitcoin - CryptoDataDownload – Binance BTC/USDT Daily OHLCV vs Bitcoin Historical Data (2010-2024)