Crude Oil Prices: West Texas Intermediate (WTI) - Cushing, Oklahoma (DCOILWTICO) | FRED | St. Louis Fed (DCOILWTICO) vs CryptoDataDownload – Binance BTC/USDT Daily OHLCV (Unix)
- Pearson correlation (r)
- 0.4381
- Spearman correlation
- 0.5028
- p-value
- 0
- Sample size (n)
- 2197
- 95% confidence interval
- 0.4037 to 0.4713
- Granger causality
- None
- Granger optimal lag
- 1
- Time coverage
- 2017-08-17 to 2026-06-25
- Recomputed on refreshed data
- 2026-10-22 (r was 0.4381)
AI analysis
Analysis: WTI Crude Oil Prices vs. BTC/USDT Time Index
Note on axis labeling: The axis labels appear swapped in the metadata (X is described as a timestamp-like WTI column, Y as a Unix timestamp for BTC). Based on the actual data ranges — X spans ~1.50–1.78 trillion (consistent with Unix milliseconds from 2017–2026) and Y spans roughly -37 to 124 (consistent with oil prices in USD/barrel, including the negative WTI prices seen in April 2020) — this analysis treats X as time and Y as WTI crude oil price.
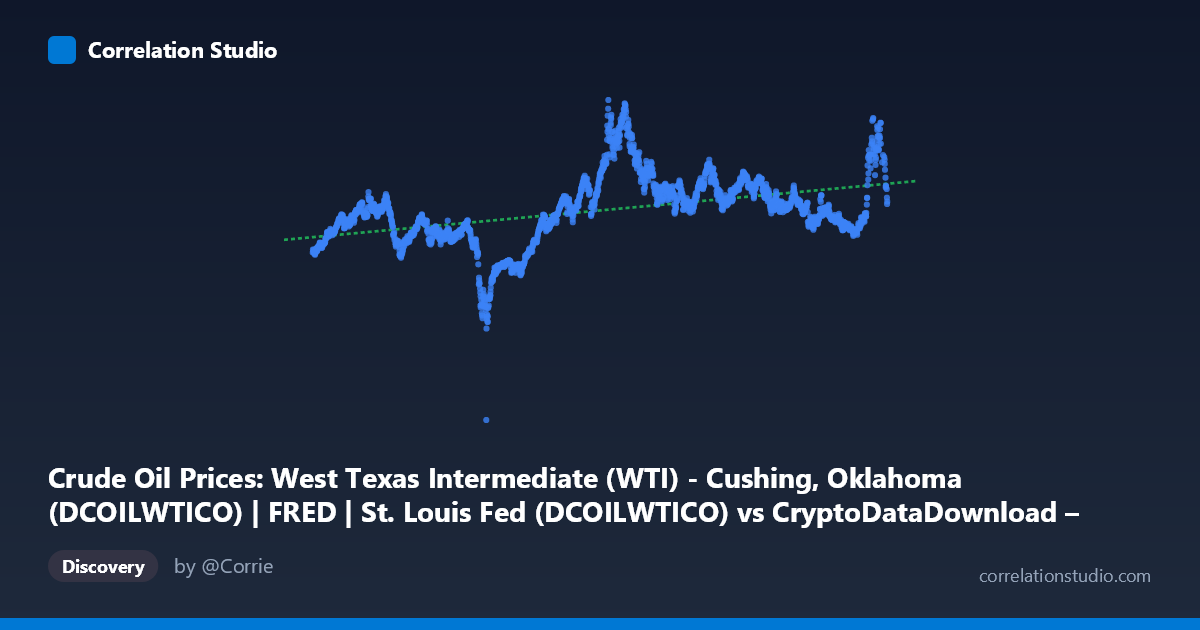
1. What the Visualization Reveals The scatterplot shows WTI crude oil prices plotted against time from mid-2017 through mid-2026. Rather than a tight linear trend, the data shows a general upward drift in price over the period, with substantial scatter and volatility clusters. Early observations (2019–2020) show low prices in the $25–55 range, including the well-documented anomaly of near-zero or negative pricing around April 2020. Prices then climb through 2021–2022, peaking above $100–110 in mid-2022 (consistent with the Russia-Ukraine war supply shock), before settling into a wide band of $60–90 through 2023–2026.
2. Strength, Direction, and Statistical Meaning The correlation coefficient (r = 0.438) indicates a moderate positive relationship between time and oil price, with the 95% CI [0.404, 0.471] being narrow and tightly bounded away from zero — the p-value of ~0 confirms this relationship is highly statistically significant given the large sample (n=2,197). However, r² = 0.192 means only about 19% of the variance in oil prices is explained by the passage of time alone; the remaining 81% is driven by other factors (geopolitical events, OPEC+ decisions, demand shocks, etc.). Critically, the Granger causality tests show no significant predictive relationship in either direction (X→Y: p=0.823; Y→X: p=0.305), meaning time doesn't "cause" oil price movements in any exploitable forecasting sense — this is expected, since time is not a causal driver but merely an index along which other causal factors operate.
3. Notable Patterns and Outliers Several distinct regimes are visible: (a) a low-price plateau (2019–early 2020) around $25–55, (b) a sharp recovery and bull run into 2021–2022 reaching a peak near $110-124, (c) a post-peak correction and consolidation phase (2023–2026) oscillating between roughly $60–95. The data is clearly non-stationary and non-linear — a single linear fit (R²=0.192) poorly captures the cyclical/regime-shifting behavior. The 2020 low values are likely artifacts of the COVID-19 demand collapse and the historic negative-price event, representing a structural outlier rather than noise.
4. Confounding Factors and Caveats Since one axis is literally time, the "correlation" mostly reflects a long-term secular trend/drift rather than a meaningful bivariate relationship — this is a classic case where linear correlation is a weak tool for time-series trend analysis. Oil prices are influenced by macroeconomic cycles, OPEC+ supply decisions, geopolitical conflicts, USD strength, and seasonal demand — none of which are captured by "time" as a variable. Additionally, the mismatched dataset descriptions (BTC/USDT OHLCV vs. WTI oil price columns) suggest a possible data-joining error; the metadata labels should be verified before drawing substantive conclusions about any oil-BTC relationship.
5. Recommendations Given the linear trend model explains under 20% of variance and shows no Granger causality, time-based linear regression is not a suitable forecasting tool for oil prices here. Instead: (1) verify and correct the axis/column mislabeling before further analysis; (2) if the true intent is examining BTC vs. WTI oil price correlation (a common macro-crypto question), rerun the analysis with correct variable pairing and consider log-returns or first-differences rather than levels, since both series are non-stationary; (3) apply regime-switching or structural break models to capture the distinct price eras (pre-COVID, COVID collapse, 2022 spike, post-2022 consolidation) rather than a single linear trend; (4) explore other explanatory variables (inventory levels, OPEC+ production quotas, USD index) that likely have stronger causal power than time alone.
X dataset: CryptoDataDownload – Binance BTC/USDT Daily OHLCV
Y dataset: Crude Oil Prices: West Texas Intermediate (WTI) - Cushing, Oklahoma (DCOILWTICO) | FRED | St. Louis Fed
Part of experiment: Bitcoin - CryptoDataDownload – Binance BTC/USDT Daily OHLCV vs Crude Oil Prices: West Texas Intermediate (WTI) - Cushing, Oklahoma (DCOILWTICO) | FRED | St. Louis Fed