Bitcoin Historical OHLCV – KuCoin BTC/USDT Daily (Volume USDT) vs Bitcoin Historical Price USD – All-Time Series (Habrador) (Price)
- Pearson correlation (r)
- 0.6846
- Spearman correlation
- 0.8674
- p-value
- 0
- Sample size (n)
- 1861
- 95% confidence interval
- 0.6597 to 0.708
- Granger causality
- None
- Granger optimal lag
- 10
- Time coverage
- 2017-10-19 to 2022-11-29
- Recomputed on refreshed data
- 2026-10-24 (r was 0.6846)
AI analysis
Analysis: Bitcoin Price vs. Trading Volume Relationship
1. Overview of the Relationship
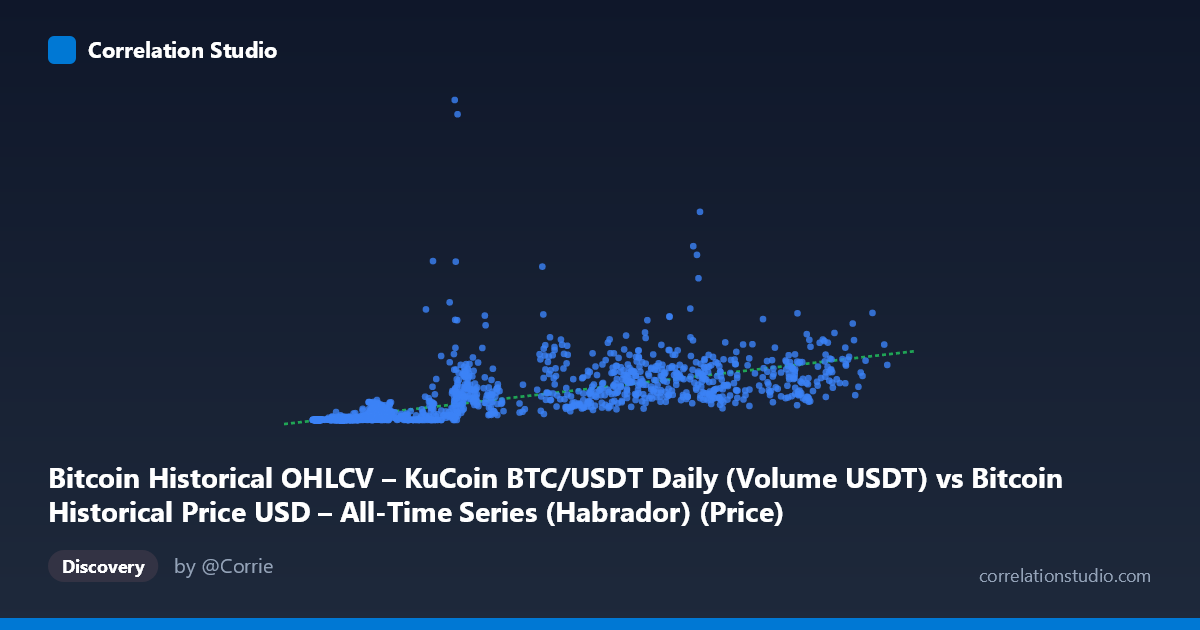
This scatterplot compares Bitcoin's price (X-axis, ranging from ~$3,178 to ~$67,634) against trading volume in USDT (Y-axis, ranging from ~$3,827 to ~$2.58 billion). The data spans a five-year window (Oct 2017–Nov 2022), capturing multiple full market cycles. The overall pattern shows a positive but noisy relationship: as price rises, volume tends to rise as well, but with substantial scatter, especially at higher price levels where volume varies by orders of magnitude for similar price points (e.g., prices near $40,000–48,000 show volumes ranging from ~$173M to ~$561M).
2. Strength, Direction, and Statistical Confidence
The Pearson correlation (r = 0.685) indicates a moderately strong positive linear relationship, with r² = 0.469 meaning only about 47% of the variance in volume is explained by price — leaving over half the variability unaccounted for by a simple linear model. The 95% CI [0.660, 0.708] is tight given the large sample (n=1,861), and the p-value of ~0 confirms the correlation is highly statistically significant — this relationship is not due to chance. However, statistical significance with large n is easy to achieve; the practical strength (r² < 0.5) is more modest and should temper expectations that price alone reliably predicts volume.
Critically, the Granger causality tests show no significant predictive direction in either direction (X→Y: p=0.58; Y→X: p=0.74) at the optimal 10-period lag. This means neither price nor volume reliably leads the other in a time-series forecasting sense — the contemporaneous correlation exists, but past values of one variable don't help predict future values of the other beyond what's already known. This is an important distinction: correlation ≠ temporal predictability.
3. Non-linear Patterns and Outliers
The note that Spearman ρ exceeds Pearson r is a strong signal that the relationship is monotonic but non-linear — likely logarithmic or power-law in nature, which makes intuitive sense given Bitcoin's exponential price history and volume's tendency to spike disproportionately during volatility events. Notable outliers include the point (28,936.36, 1,237,284,954.74) — a volume nearly 4x higher than neighboring price points, suggesting a volatility spike or major market event decoupled from price level alone. Conversely, many low-price points (<$10,000) cluster with very low volumes near zero, while mid-range prices ($19,000–30,000) show wide volume dispersion, hinting at regime-dependent behavior (bull run euphoria, crash panic-selling, etc.) that a simple linear fit cannot capture.
4. Confounding Factors and Caveats
Several caveats apply. First, both variables are drawn from different underlying datasets/exchanges (one general historical price series, one KuCoin-specific OHLCV) which may introduce venue-specific volume idiosyncrasies not representative of the broader market. Second, time itself is a major confound: price and volume both trended upward over 2017–2022 due to overall market growth and exchange adoption, meaning some of the correlation may be spurious trend-driven co-movement rather than a direct causal link. Third, volume is inherently volatility-sensitive — news events, regulatory announcements, and liquidations can cause huge volume spikes independent of the prevailing price level, explaining much of the unexplained variance (53%). Finally, sampling "every 37th point" for illustration may not fully represent clustering/density patterns in the full 1,861-point dataset.
5. Recommendations for Further Investigation
Given the Spearman/Pearson discrepancy, refitting with a log-log or log-linear model (log(Volume) ~ log(Price) or Price) would likely substantially improve explanatory power. Additionally, since Granger causality was insignificant, consider testing volatility (not price) as a predictor of volume — volume often correlates more strongly with price changes or realized volatility than with price level. Segmenting the analysis by market regime (bull vs. bear phases) or using rolling-window correlations could reveal whether the relationship strengthens/weakens over time. Finally, exploring whether volume leads price at shorter lags (e.g., 1–3 days) rather than the tested 10-period lag might uncover microstructure effects lost at longer horizons.
X dataset: Bitcoin Historical Price USD – All-Time Series (Habrador)
Y dataset: Bitcoin Historical OHLCV – KuCoin BTC/USDT Daily
Part of experiment: Bitcoin - Bitcoin Historical Price USD – All-Time Series (Habrador) vs Bitcoin Historical OHLCV – KuCoin BTC/USDT Daily