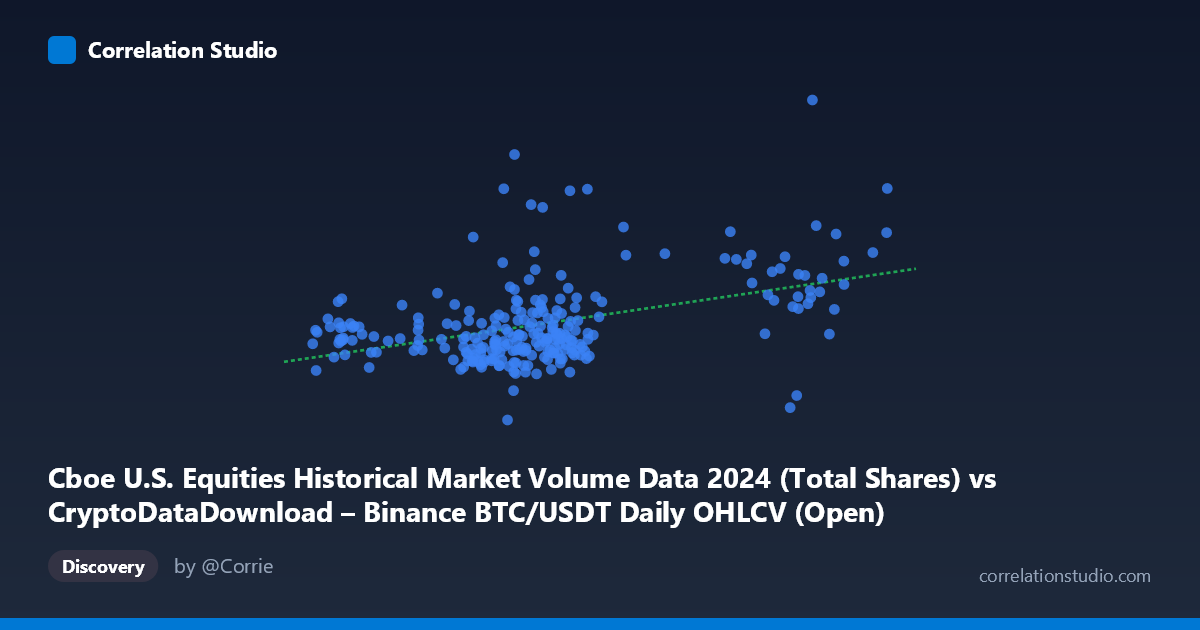
Cboe U.S. Equities Historical Market Volume Data 2024 (Total Shares) vs CryptoDataDownload – Binance BTC/USDT Daily OHLCV (Open)
- Pearson correlation (r)
- 0.4331
- Spearman correlation
- 0.3436
- p-value
- 0
- Sample size (n)
- 252
- 95% confidence interval
- 0.3271 to 0.5284
- Granger causality
- None
- Granger optimal lag
- 10
AI analysis
Analysis: Cboe U.S. Equities Volume vs. Binance BTC/USDT Open Price
Note on axis labeling: The axis labels appear swapped relative to their descriptions — the "X-axis" is described as Cboe equities volume data but the sample values (39,568–106,133) align with BTC/USDT pricing scale in the Y-axis description, while the Y-values (379M–1.25B) look like equity volume figures. Given the mismatch, this analysis treats X as BTC/USDT Open price and Y as Cboe total shares volume, consistent with the numerical ranges shown.
1. Relationship Overview The scatterplot shows a positive but noisy association: as one variable increases, the other tends to rise as well, though with substantial scatter around the trend line (y = 3459.44x + 4.13E+08). The data does not form a tight linear band — points are widely dispersed vertically at almost every x-value, indicating that x alone is a weak-to-moderate predictor of y.
2. Strength, Direction, and Uncertainty The correlation coefficient (r = 0.433) indicates a moderate positive relationship, but r² = 0.188 reveals that only ~19% of the variance in one variable is explained by the other — meaning over 80% of the variation is driven by other factors entirely. The 95% CI [0.327, 0.528] is reasonably tight given n=252, and the p-value (6.0E-13) confirms this correlation is highly statistically significant — it's very unlikely to be due to chance. However, statistical significance ≠ practical strength; this is a real but modest relationship. Critically, the Granger causality tests show no significant predictive direction in either direction (X→Y: p=0.236; Y→X: p=0.869), meaning neither series reliably helps forecast the other's future values based on past observations at the tested lag structure. This suggests the correlation may reflect contemporaneous co-movement (e.g., both responding to shared macro conditions) rather than one variable driving the other over time.
3. Patterns, Clusters, and Outliers Most data clusters in the x-range of 55,000–72,000, with y-values concentrated between 500M–800M — this is the "core cloud" driving the regression fit. A secondary cluster appears at higher x-values (94,000–101,000) with y-values in the 400M–825M range, showing more scatter and potentially different behavior (e.g., lower slope or a plateau). Notable outliers include a point near (58,161, 877M) and (64,870, 966M) — both high-y outliers within the core x-range — and (62,135, 379.6M), the minimum y-value, which sits well below the trend. These outliers likely correspond to specific high-volatility trading days (news events, expirations, or year-end effects) and contribute disproportionately to the scatter.
4. Confounding Factors and Caveats Both series are time-based (2024 daily data), making them susceptible to shared macro drivers — overall market volatility, risk-on/risk-off sentiment, seasonal volume patterns (e.g., quarter-end rebalancing, holidays), or crypto-equity spillover effects — rather than a direct causal link between BTC price and equity share volume. Additionally, financial time series often exhibit autocorrelation and volatility clustering, meaning daily observations aren't independent; this can inflate apparent correlation without deeper causal linkage. Since Granger causality was insignificant, the correlation may simply reflect two series that trend similarly over the year (e.g., both rising in bull-market months) without one leading the other.
5. Suggestions for Further Investigation - Test contemporaneous vs. lagged relationships more granularly — try shorter lags (1–5 days) or non-linear lag structures, since the "optimal lag = 10" may have masked shorter-term dynamics. - Segment by market regime (bull/bear/sideways months) to see if the correlation strengthens or weakens during specific volatility periods — the high-x cluster (94K–101K) may represent a distinct regime worth isolating. - Control for a third variable — e.g., a shared volatility index (VIX) or overall crypto market cap — using partial correlation or multivariate regression to see if the BTC-equity link is spurious. - Investigate the outlier days individually (e.g., the 966M and 877M volume spikes) to determine if they correspond to specific news/events that could be excluded or modeled separately. - Given r² of only 19%, avoid using this relationship for point forecasting; it may have some value in a multi-factor model but is insufficient as a standalone predictive signal.
X dataset: CryptoDataDownload – Binance BTC/USDT Daily OHLCV
Y dataset: Cboe U.S. Equities Historical Market Volume Data 2024
Part of experiment: Bitcoin - CryptoDataDownload – Binance BTC/USDT Daily OHLCV vs Cboe U.S. Equities Historical Market Volume Data 2024