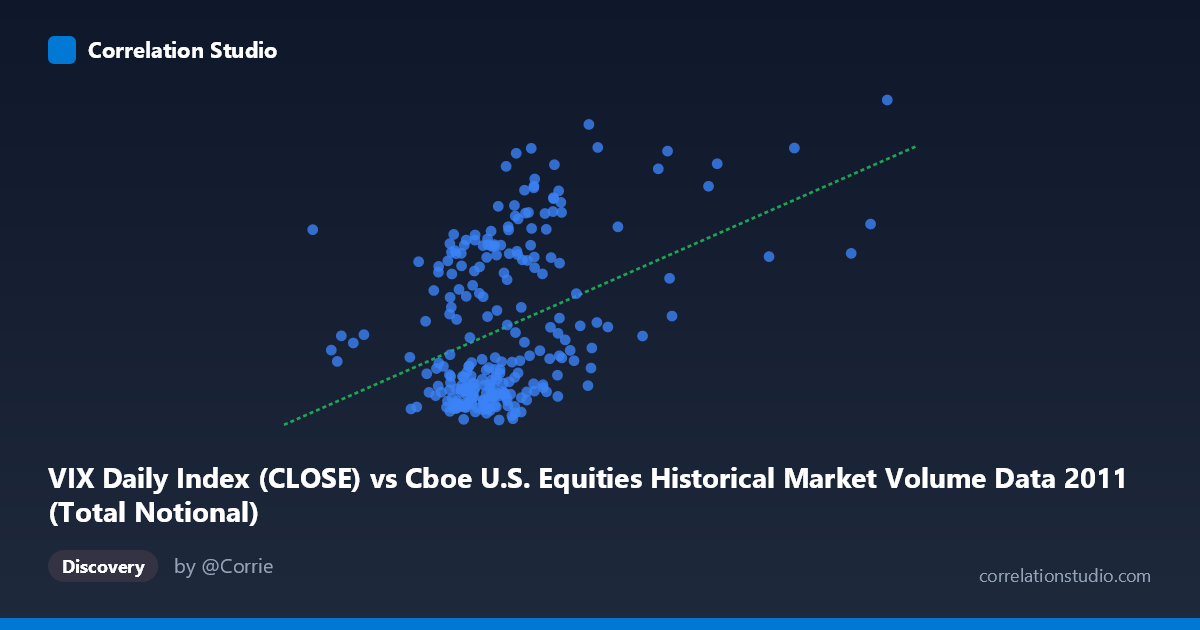
VIX Daily Index (CLOSE) vs Cboe U.S. Equities Historical Market Volume Data 2011 (Total Notional)
- Pearson correlation (r)
- 0.4124
- Spearman correlation
- 0.3588
- p-value
- 0
- Sample size (n)
- 252
- 95% confidence interval
- 0.3043 to 0.51
- Granger causality
- None
- Granger optimal lag
- 1
- Time coverage
- 2011-01-03 to 2011-12-30
- Recomputed on refreshed data
- 2026-10-09 (r was 0.4124)
AI analysis
Scatterplot Analysis: VIX vs. Total Notional Trading Volume (2011)
Relationship Overview The scatterplot reveals a modest positive relationship between the CBOE Volatility Index (VIX) daily close values and total notional trading volume in U.S. equities markets throughout 2011. The linear regression equation (y = 8.24×10⁻¹⁰x + 10.29) confirms that as notional trading volume increases, VIX tends to rise — a directionally intuitive finding, since heightened market anxiety typically drives both increased trading activity and elevated volatility readings. However, the scatter is wide, and the relationship is far from deterministic, with substantial dispersion visible across all volume ranges.
Correlation Strength and Statistical Significance The Pearson correlation of r = 0.4124 indicates a moderate positive association, but the explanatory power is limited: R² = 0.17 means that only 17% of the variance in VIX is explained by notional trading volume, leaving 83% attributable to other factors. The 95% confidence interval of [0.30, 0.51] is meaningfully above zero and relatively tight given the sample size (n = 252), and the p-value of 9.15×10⁻¹² confirms the correlation is highly statistically significant — effectively ruling out a chance finding. That said, statistical significance here is partly a function of the large population (N = 3,780) and should not be conflated with practical or predictive importance. Critically, Granger causality tests find no significant predictive direction in either direction (X→Y: F = 0.032, p = 0.858; Y→X: F = 0.0007, p = 0.979), meaning that lagged values of either variable do not meaningfully predict the other at a 1-period lag. This absence of temporal directionality cautions strongly against interpreting the correlation as evidence of a leading or causal mechanism.
Notable Patterns, Clusters, and Outliers Several structural features are visible in the data. A dense cluster of low-VIX, moderate-volume observations (VIX ~15–22, volume ~12–18 billion) dominates the lower-left region, suggesting a "calm market" regime that characterized portions of early 2011. A separate, more dispersed cluster at higher VIX values (30–48) spans a wide volume range, consistent with the episodic volatility spikes of mid-to-late 2011 (e.g., the U.S. debt ceiling crisis and European sovereign debt concerns in August–September). Several apparent outliers stand out at very high VIX (40) and simultaneously high notional volume (25 billion), likely corresponding to specific extreme market stress days. The sample points confirm this bimodal character — numerous observations cluster near VIX 16–20, while a distinct high-VIX tail is visible, suggesting the distribution may not be well-served by a single linear fit.
Confounding Factors and Caveats Several important caveats apply. First, 2011 was a structurally unusual year — it contained both tranquil periods and acute crisis episodes (debt ceiling, S&P downgrade of U.S. debt, European contagion), which may artificially inflate the correlation by introducing a bimodal regime structure rather than a smooth continuous relationship. Second, the axes appear to be swapped in labeling (the dataset descriptions indicate VIX is on the X-axis as "CLOSE" and notional volume is on the Y-axis), which should be verified, as the causal intuition differs depending on directionality. Third, notional volume is influenced by price levels — during high-VIX periods, prices are often falling, which could mechanically reduce notional value even if share volume rises, introducing a suppression effect. Fourth, the Granger test used only a 1-period lag; longer lags might reveal different temporal dynamics. Finally, omitted variables such as macroeconomic news flow, Federal Reserve communications, and index rebalancing activity are likely driving both series simultaneously.
Actionable Insights and Further Investigation Practitioners should treat VIX and notional volume as co-indicators of market stress regimes rather than predictors of each other. The lack of Granger causality at lag-1 means a simple trading rule based on yesterday's volume predicting today's VIX (or vice versa) would be unreliable. Further investigation should include: (1) regime-switching or segmented regression analysis to separately model calm vs. stressed market periods; (2) testing longer Granger lags (5, 10, 22 days) to detect slower-moving relationships; (3) incorporating additional volatility drivers (e.g., realized volatility, options open interest, macroeconomic surprise indices) to build a more complete explanatory model; and (4) replicating this analysis across multiple years to assess whether the r = 0.41 finding is stable or an artifact of 2011's particular stress events.
X dataset: Cboe U.S. Equities Historical Market Volume Data 2011
Y dataset: VIX Daily Index
Part of experiment: Daily - Cboe U.S. Equities Historical Market Volume Data 2011 vs VIX Daily Index