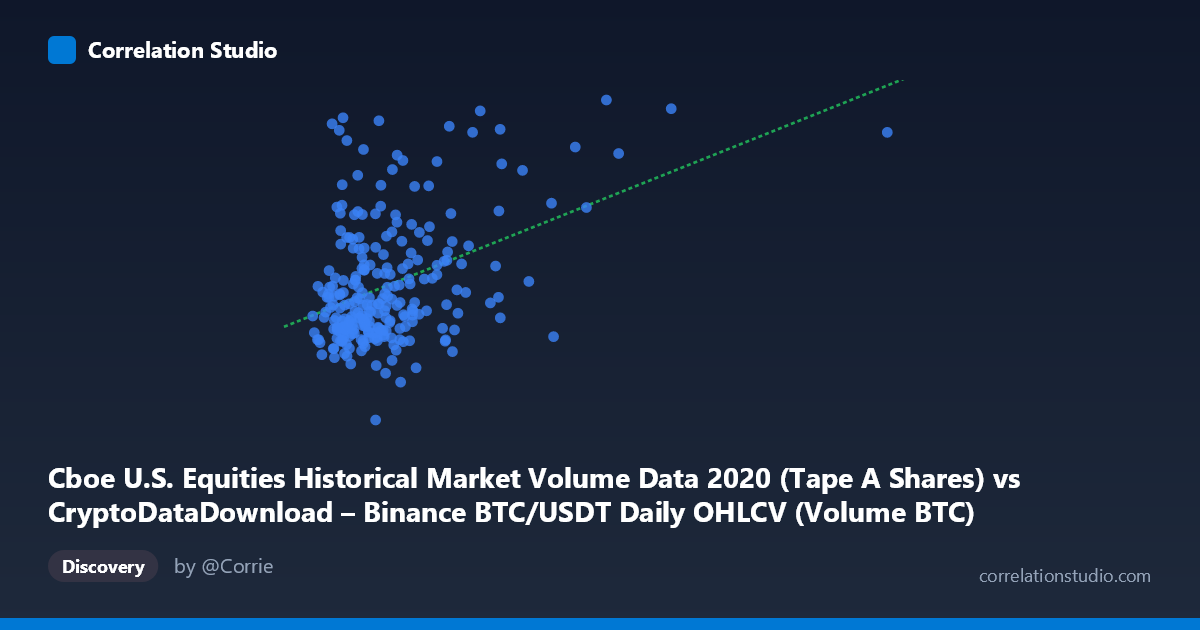
Cboe U.S. Equities Historical Market Volume Data 2020 (Tape A Shares) vs CryptoDataDownload – Binance BTC/USDT Daily OHLCV (Volume BTC)
- Pearson correlation (r)
- 0.4181
- Spearman correlation
- 0.2701
- p-value
- 0
- Sample size (n)
- 253
- 95% confidence interval
- 0.3108 to 0.5149
- Granger causality
- None
- Granger optimal lag
- 10
- Time coverage
- 2020-01-02 to 2020-12-31
AI analysis
Analysis: Cboe Equities Volume vs. Binance BTC/USDT Volume (2020)
1. What the Visualization Reveals
The scatterplot shows a weak-to-moderate positive relationship between U.S. equities trading volume (Cboe Tape A) and Binance BTC/USDT volume across 253 paired daily observations in 2020. The majority of points cluster in the lower-left region (X: 40,000–120,000; Y: 200M–350M), indicating that most days saw relatively modest equities volume paired with moderate crypto volume. However, a handful of high-Y outliers (BTC volume exceeding 400–500M) appear across a wide range of X values, suggesting these volume spikes were not tightly tied to equities activity.
2. Strength, Direction, and Statistical Confidence
The correlation coefficient (r = 0.418) indicates a positive but modest linear relationship. Critically, r² = 0.175 means only about 17.5% of the variance in Binance BTC volume is explained by Cboe equities volume — the remaining 82.5% is driven by other factors (crypto-specific news, volatility, exchange dynamics, etc.). The 95% CI [0.311, 0.515] is reasonably tight and excludes zero, and the p-value (4×10⁻¹²) confirms the correlation is statistically significant and not due to chance. However, statistical significance with a large-ish sample should not be conflated with practical/predictive strength — this is a weak-to-moderate association, not a tight coupling.
Importantly, the Granger causality tests show no significant predictive direction in either direction (X→Y: p=0.853; Y→X: p=0.223) at the tested lag structure (10 periods). This means neither market's volume reliably precedes or forecasts the other's volume over time — the contemporaneous correlation does not translate into a temporal lead-lag relationship. This strongly suggests the correlation reflects shared exposure to common macro conditions (e.g., overall market volatility, pandemic-driven trading activity in 2020) rather than one market driving the other.
3. Notable Patterns and Outliers
Several outliers stand out: a few days (e.g., ~71,155 X / 535M Y; ~47,788 X / 540M Y) show extreme BTC volume spikes with only average equities volume — likely corresponding to crypto-specific events (e.g., March 2020 COVID crash, DeFi summer volatility, or exchange-specific liquidity events). Conversely, the single extreme X outlier (402,201) with Y at 518M sits far outside the main X cluster, and could be exerting outsized leverage on the regression slope despite being a single data point — this warrants a sensitivity check (e.g., removing it and re-fitting). The bulk of the data shows a loosely upward-sloping cloud with substantial scatter, consistent with a low r² rather than a tight linear band.
4. Confounding Factors and Caveats
2020 was an unusual year: COVID-19 volatility, the "COVID crash" in March, and the beginning of the crypto bull run all created simultaneous volume surges across asset classes without necessarily implying causal linkage. Both series likely responded to shared macro volatility (VIX spikes, retail trading booms, fiscal stimulus effects) rather than one influencing the other directly. Additionally, differing market structures (23andMe of equities market hours/circuit breakers and reporting vs. 24/7 crypto trading), currency composition (BTC/USDT vs. USD equities), and the fact that Tape A only captures a subset of consolidated equities volume are all structural mismatches that limit direct comparability.
5. Suggestions for Further Investigation
- Re-run regression excluding the X=402,201 outlier to check robustness of the slope/r². - Test correlation with lagged/leading windows (e.g., 1–3 days) rather than only the 10-period Granger lag, since volume shocks may propagate faster. - Segment by volatility regime (e.g., March 2020 crash vs. rest of year) to see if the correlation is driven primarily by the pandemic shock period. - Incorporate a third common driver (e.g., VIX, S&P 500 volume, or overall crypto market cap) to test whether both series are proxies for broader "risk-on" trading activity rather than being directly related. - Given the lack of Granger causality, avoid using one series to forecast the other in any trading or risk model; treat the relationship as coincidental/co-driven rather than predictive.
X dataset: CryptoDataDownload – Binance BTC/USDT Daily OHLCV
Y dataset: Cboe U.S. Equities Historical Market Volume Data 2020
Part of experiment: Bitcoin - CryptoDataDownload – Binance BTC/USDT Daily OHLCV vs Cboe U.S. Equities Historical Market Volume Data 2020