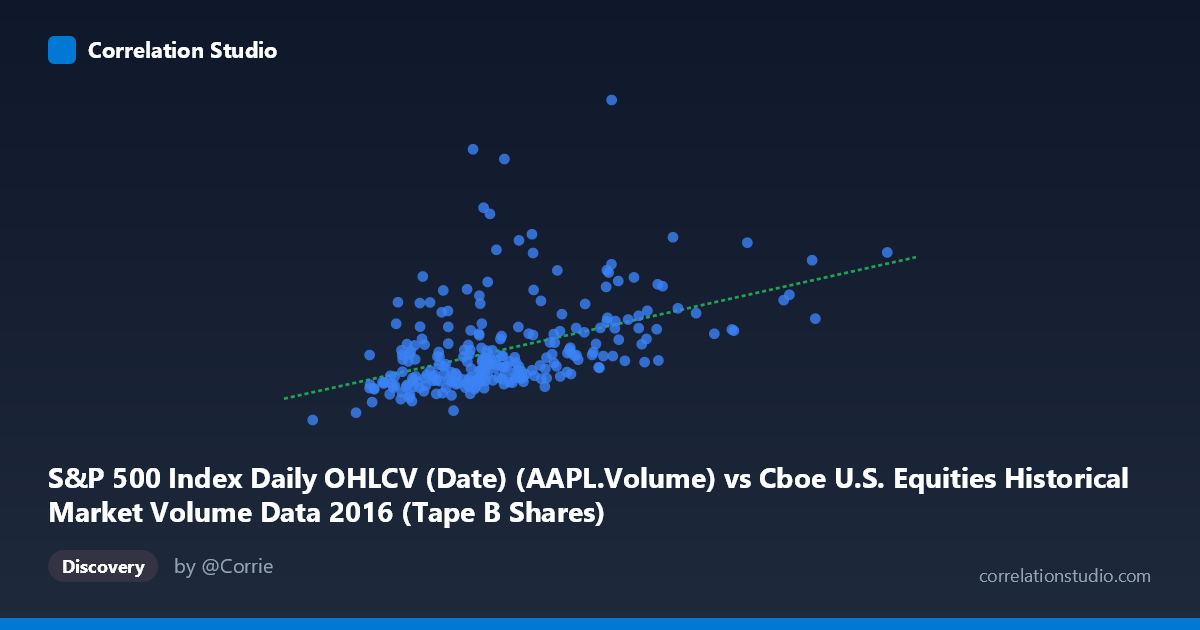
S&P 500 Index Daily OHLCV (Date) (AAPL.Volume) vs Cboe U.S. Equities Historical Market Volume Data 2016 (Tape B Shares)
- Pearson correlation (r)
- 0.4562
- Spearman correlation
- 0.5284
- p-value
- 0
- Sample size (n)
- 252
- 95% confidence interval
- 0.3525 to 0.5488
- Granger causality
- None
- Granger optimal lag
- 10
AI analysis
Scatterplot Analysis: AAPL Volume vs. Cboe Tape B Shares (2016)
1. Relationship Overview
The scatterplot reveals a moderate positive relationship between Apple Inc.'s daily trading volume (S&P 500 OHLCV dataset, X-axis) and Cboe U.S. Equities Tape B share volume (Y-axis) across 252 trading days in 2016. As AAPL volume increases, Tape B shares tend to rise as well, consistent with the linear regression equation y = 0.2575x + 10,819,800. This broad positive trend makes intuitive sense: periods of elevated market activity or investor interest — particularly around major indices components like AAPL — tend to coincide with heightened trading across broader equity tape segments. However, the scatter is wide and the relationship is far from deterministic, suggesting many trading days deviate substantially from this trend line.
2. Correlation Strength, Direction, and Causality
The Pearson correlation of r = 0.4562 indicates a moderate positive association, but the coefficient of determination r² = 0.2081 tells the more sobering story: only about 20.8% of the variance in Tape B volume is explained by AAPL volume, leaving nearly 80% attributable to other factors. The 95% confidence interval of [0.3525, 0.5488] is reasonably tight and excludes zero entirely, and the p-value of 2.354 × 10⁻¹⁴ confirms the correlation is highly statistically significant — this is not a chance artifact. Despite statistical significance, the Granger causality analysis is telling: neither X→Y (F = 1.22, p = 0.279) nor Y→X (F = 0.91, p = 0.528) reaches significance at any standard threshold across the optimal 10-period lag. This means that past AAPL volume does not meaningfully predict future Tape B volume, and vice versa — the contemporaneous correlation likely reflects shared market-wide drivers rather than any directional predictive or causal mechanism between the two series.
3. Notable Patterns, Outliers, and Clusters
The sample points reveal several noteworthy features. The bulk of observations cluster in a relatively dense core where AAPL volume falls between roughly 75M–130M and Tape B shares range from approximately 24M–55M, suggesting these represent "normal" trading day conditions. However, there are clear outliers that warrant attention: the point near (142.6M, 133.4M) represents an extreme Y-value — Tape B volume more than double the typical range — and likely corresponds to a high-volatility event day. Similarly, points around (100.2M, 92.3M) and (104.4M, 76.3M) show disproportionately high Tape B activity relative to AAPL volume. On the higher X-end, the point near (170.6M, 52.2M) shows elevated AAPL volume but only moderate Tape B response, illustrating asymmetry in the relationship. This dispersion pattern hints at possible non-linearity or regime-dependent behavior, where the relationship strengthens during stress events but weakens during normal conditions.
4. Confounding Factors and Interpretive Caveats
Several important caveats temper interpretation. First, both series are likely driven by shared macroeconomic or market-structure factors — Federal Reserve announcements, earnings seasons, geopolitical events, and index rebalancing days — meaning the correlation may be largely spurious co-movement rather than a meaningful link between AAPL-specific trading and Tape B activity. Second, the dataset mismatch is notable: AAPL volume comes from the S&P 500 OHLCV dataset while Tape B shares come from the Cboe market volume dataset, raising questions about whether the pairing is conceptually coherent or partly an artifact of how these datasets were aligned. Third, n = 252 paired samples from a population of N = 506 introduces potential sampling bias if the selected days are not representative of the full year. Finally, Tape B specifically covers NYSE American (AMEX) and regional exchange-listed securities — not AAPL itself, which is NASDAQ-listed (Tape C) — making the direct mechanistic link less obvious and strengthening the case that any correlation is mediated by broader market activity.
5. Actionable Insights and Further Investigation
Given the moderate correlation and absent Granger causality, practitioners should avoid using AAPL volume as a predictive signal for Tape B activity in any trading or risk model — the temporal evidence simply does not support it. However, the shared contemporaneous variance does suggest value in investigating common latent drivers: a regression controlling for VIX levels, macro announcement calendars, or overall NYSE/NASDAQ composite volume would likely absorb much of the apparent r² and clarify whether any residual AAPL-specific effect remains. The outlier days (particularly the extreme Tape B spike near 133M) deserve individual investigation — identifying what events drove those sessions could reveal whether the relationship is conditionally stronger during stress regimes. More broadly, a rolling-window correlation analysis across 2016 subperiods would test whether the r ≈ 0.46 is stable year-round or concentrated in specific market episodes, which would have significant implications for how this relationship should be modeled and weighted.
X dataset: Cboe U.S. Equities Historical Market Volume Data 2016
Y dataset: S&P 500 Index Daily OHLCV (Date)
Part of experiment: Daily - Cboe U.S. Equities Historical Market Volume Data 2016 vs S&P 500 Index Daily OHLCV (Date)