Cboe U.S. Equities Historical Market Volume Data 2010 (Total Trade Count) vs Brent Crude Oil Prices: Daily (DCOILBRENTEU) – FRED St. Louis Fed (DCOILBRENTEU)
- Pearson correlation (r)
- -0.484
- Spearman correlation
- -0.4855
- p-value
- 0
- Sample size (n)
- 252
- 95% confidence interval
- -0.5733 to -0.3834
- Granger causality
- None
- Granger optimal lag
- 10
AI analysis
Analysis: Brent Crude Oil Price vs. U.S. Equity Trade Count (2010)
Relationship Overview
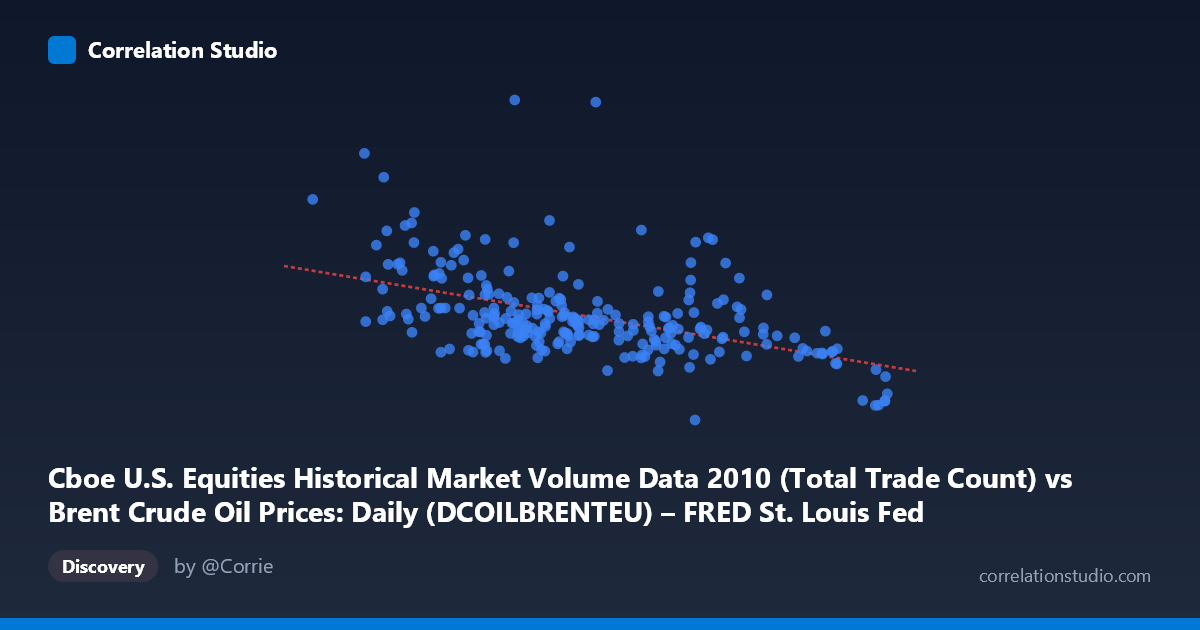
The scatterplot reveals a moderate negative relationship between Brent Crude Oil prices (X-axis, in USD/barrel) and U.S. equity market trade counts (Y-axis) across 252 trading days in 2010. As oil prices rise — ranging from roughly $67 to $94 per barrel — daily trade counts tend to decline, spanning a wide range from approximately 648,000 to 5.5 million trades. The linear regression equation (y = -54,912x + 6,606,880) quantifies this inverse slope, suggesting that each additional dollar in oil price is associated with roughly 55,000 fewer trades. However, the scatter around this regression line is substantial, indicating the relationship is real but far from deterministic.
Correlation Strength and Statistical Significance
The Pearson correlation of r = -0.484 indicates a moderate negative association, but the explanatory power is notably limited: R² = 0.234, meaning oil prices account for only about 23.4% of the variance in trade counts. The remaining ~76.6% is explained by other factors entirely. The 95% confidence interval of [-0.573, -0.383] is meaningfully wide, reflecting genuine uncertainty in the precise strength of this relationship, though it does not cross zero. The p-value of 2.22E-16 confirms the result is highly statistically significant given the full population context of N = 3,302, making it extremely unlikely to be a chance finding. Critically, however, the Granger causality tests fail in both directions (X→Y: F = 0.88, p = 0.55; Y→X: F = 0.91, p = 0.52), meaning neither variable temporally predicts the other at any of the tested lags up to 10 periods. This firmly rules out a straightforward predictive or causal relationship — the correlation is associative, not directional.
Notable Patterns, Clusters, and Outliers
Several structural features complicate the simple linear narrative. The data appears to form two loosely distinct clusters: one concentrated around mid-range oil prices (74–82 $/bbl) with moderate trade counts (1.5–2.5M), and another at lower oil prices (67–76 $/bbl) with considerably more spread in trade activity, including some very high values. There are clear outliers worth noting — most prominently the point near (76.48, 5,514,534), which represents an exceptionally high trade count at a mid-range oil price, and the cluster of high-trade days at low prices (e.g., 67.18, 4,002,972 and 70.45, 4,340,243). At the high end of oil prices (88–94 $/bbl), trade counts appear consistently low and compressed, suggesting a potential ceiling effect or regime change in trading behavior above ~88 $/bbl. The relationship may be better characterized as non-linear, with a steeper drop-off at extreme oil prices.
Confounding Factors and Interpretive Caveats
Several important caveats temper interpretation. First, 2010 was a highly specific macroeconomic environment — a post-financial crisis recovery year — where both oil prices and equity market activity were simultaneously influenced by broad risk sentiment, Federal Reserve policy, and economic recovery signals. Any observed correlation may largely reflect their shared sensitivity to a common underlying driver (e.g., risk-on/risk-off dynamics) rather than a direct relationship. Second, the axis labels appear to be swapped in the dataset metadata (the X-axis is labeled as trade count data from a Brent Crude dataset, and vice versa), which warrants verification before drawing firm conclusions. Third, daily trade counts on U.S. equity exchanges are influenced by earnings seasons, index rebalancing, and volatility events that are entirely orthogonal to oil prices. The failed Granger causality tests reinforce that no lagged predictive signal exists, making any causal interpretation unsupportable with this data alone.
Actionable Insights and Further Investigation
Despite the modest explanatory power, this correlation is worth pursuing further under a more rigorous framework. Analysts should consider controlling for the VIX (volatility index), which likely mediates both variables simultaneously — high volatility periods tend to spike trade volumes and correlate with oil price dislocations. Sector-level decomposition of trade counts (e.g., isolating energy sector equities) could reveal whether the relationship is stronger in specific market segments. Additionally, testing this relationship across multiple years would help determine whether the 2010 pattern is structural or idiosyncratic to post-crisis dynamics. Given the visible non-linearity, fitting a polynomial or piecewise regression may better capture the apparent threshold behavior above ~88 $/bbl. Finally, a rolling-window correlation analysis could reveal whether the relationship strengthens during specific market regimes, potentially making it a useful conditional signal even if it lacks unconditional Granger predictability.
X dataset: Brent Crude Oil Prices: Daily (DCOILBRENTEU) – FRED St. Louis Fed
Y dataset: Cboe U.S. Equities Historical Market Volume Data 2010
Part of experiment: Daily - Brent Crude Oil Prices: Daily (DCOILBRENTEU) – FRED St. Louis Fed vs Cboe U.S. Equities Historical Market Volume Data 2010