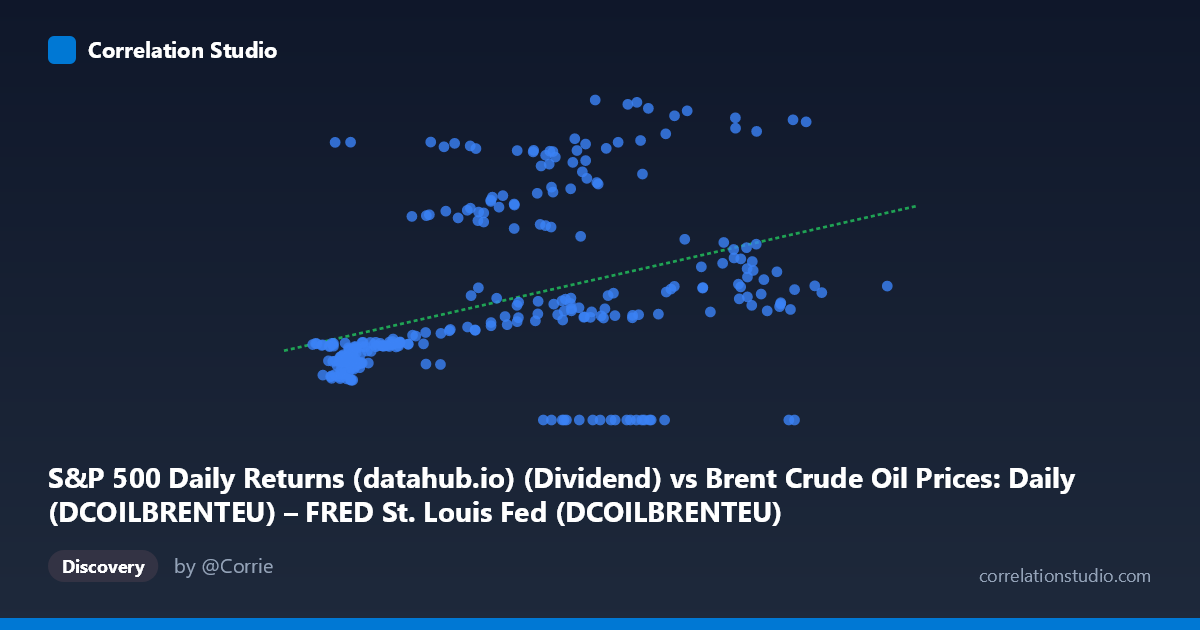
S&P 500 Daily Returns (datahub.io) (Dividend) vs Brent Crude Oil Prices: Daily (DCOILBRENTEU) – FRED St. Louis Fed (DCOILBRENTEU)
- Pearson correlation (r)
- 0.4076
- Spearman correlation
- 0.5278
- p-value
- 0
- Sample size (n)
- 297
- 95% confidence interval
- 0.308 to 0.4983
- Granger causality
- None
- Granger optimal lag
- 1
AI analysis
Scatterplot Analysis: Brent Crude Oil Prices vs. S&P 500
1. Overall Relationship Pattern
The scatterplot reveals a modest positive association between daily Brent crude oil prices (X-axis) and S&P 500 monthly price levels (Y-axis), with the linear regression line (y = 0.216x + 14.16) sloping gently upward across the data range. However, the visual immediately signals complexity: the data is not cleanly distributed around this trend line. Instead, there is considerable vertical scatter at nearly every X value, and a notable cluster of low-X/low-Y points dominates the lower-left region, suggesting that the relationship is heavily influenced by the historical period during which both oil prices and equity valuations were relatively low. The wide spread across Y values at mid-to-high X values further hints that the linear model is an oversimplification of what is likely a more nuanced, regime-dependent relationship.
2. Correlation Strength, Direction, and Causality
The Pearson correlation of r = 0.408 indicates a statistically significant but practically weak-to-moderate positive relationship. More critically, r² = 0.166, meaning that Brent crude oil prices explain only about 16.6% of the variance in S&P 500 price levels — leaving over 83% of variation attributable to other factors entirely. While the 95% confidence interval [0.308, 0.498] confirms the correlation is reliably above zero and the p-value of 2.59×10⁻¹³ is highly significant (driven largely by the large sample of N = 1,865), statistical significance here should not be mistaken for practical predictive power. Crucially, Granger causality tests find no significant directional relationship in either direction — neither oil prices predicting equity levels (F = 1.19, p = 0.276) nor equity levels predicting oil prices (F = 0.10, p = 0.755). This means that knowing today's crude price offers no statistically meaningful edge in forecasting tomorrow's S&P 500 level, and vice versa, undermining any simple trading or forecasting strategy built on this correlation alone.
3. Notable Patterns, Clusters, and Outliers
Several structural features deserve attention. First, there is a dense cluster of observations in the lower-left quadrant (X: 10–30, Y: 8–20), likely representing the pre-2000 era when oil prices were chronically low and equity valuations were more modest. Second, several zero-valued Y observations appear at varying X values (e.g., points at X ≈ 67, 73, 85, 87 with Y = 0.00), which are almost certainly data artifacts or missing-value placeholders that should be investigated and potentially excluded, as they exert undue influence on the regression slope. Third, the upper-right region contains high-variance, widely dispersed points — for example, at X ≈ 74–86, Y ranges from near zero to nearly 68 — suggesting that at high oil price regimes, the relationship between these variables effectively breaks down. The note that Spearman ρ exceeds Pearson r further confirms a non-linear underlying structure, where a logarithmic or polynomial model would likely fit the data better than the current linear formulation.
4. Confounding Factors and Interpretive Caveats
The most important caveat is that this correlation almost certainly reflects shared secular trends rather than a direct economic link. Both Brent crude and S&P 500 prices have generally trended upward over the 1987–2026 time horizon due to inflation, dollar depreciation, global economic growth, and monetary expansion — creating a spurious long-run co-movement that statistical correlation captures but does not validate as causal. The datasets also operate on different time frequencies (daily oil prices vs. monthly equity index levels), introducing temporal mismatch that complicates direct comparison and likely attenuates true short-run relationships. Additionally, the relationship between oil and equities is regime-dependent: rising oil prices may signal economic strength (positive for equities) in some periods, but supply-shock-driven oil spikes historically damage equity markets. These opposing mechanisms can cancel out in aggregate correlation estimates, masking important conditional dynamics.
5. Actionable Insights and Further Investigation
Given the weak explanatory power and absence of Granger causality, this correlation alone is insufficient to support any directional trading or policy signal. Immediate next steps should include: (1) investigating and removing or correcting the zero-valued Y observations, which appear to be data quality issues; (2) fitting a logarithmic or polynomial regression to better capture the non-linear relationship flagged by the Spearman vs. Pearson discrepancy; (3) segmenting the analysis by distinct macroeconomic regimes (e.g., pre-2000, 2000–2008, post-GFC, post-COVID) to test whether the correlation is stable or structurally shifting; and (4) introducing control variables such as real interest rates, dollar index (DXY), or global GDP growth to partial out shared secular trends. A rolling-window correlation analysis over time would also reveal whether this relationship has strengthened or weakened across different commodity and equity market cycles, providing far more actionable context than the pooled estimate currently offers.
X dataset: Brent Crude Oil Prices: Daily (DCOILBRENTEU) – FRED St. Louis Fed
Y dataset: S&P 500 Daily Returns (datahub.io)
Part of experiment: Daily - Brent Crude Oil Prices: Daily (DCOILBRENTEU) – FRED St. Louis Fed vs S&P 500 Daily Returns (datahub.io)