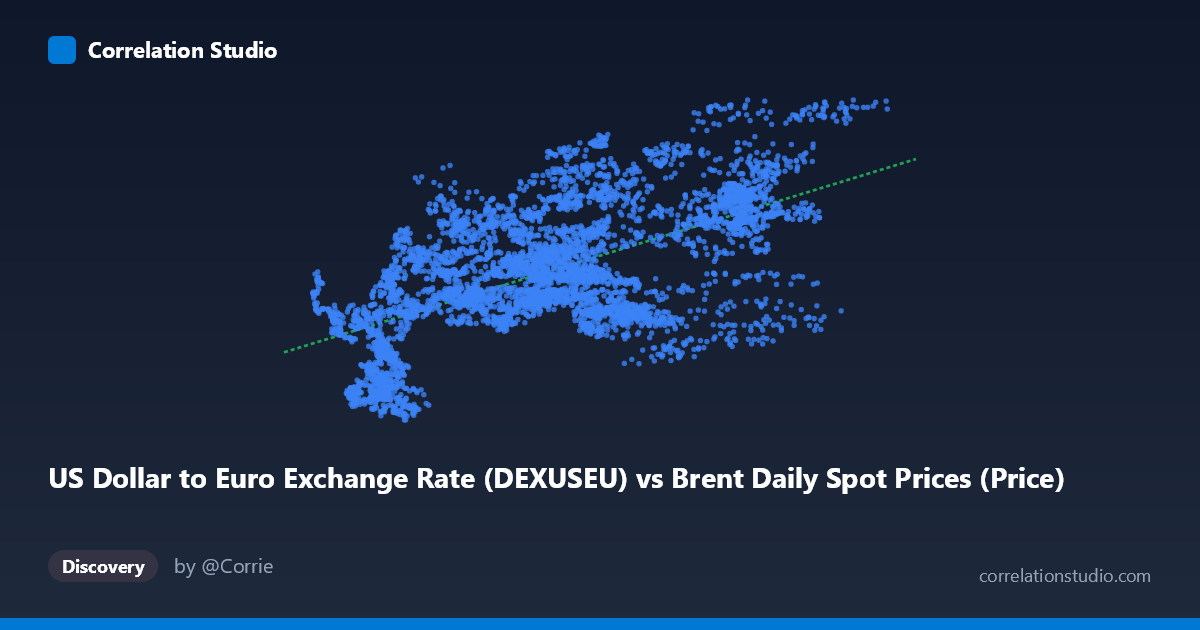
US Dollar to Euro Exchange Rate (DEXUSEU) vs Brent Daily Spot Prices (Price)
- Pearson correlation (r)
- 0.6077
- Spearman correlation
- 0.5537
- p-value
- 0
- Sample size (n)
- 6772
- 95% confidence interval
- 0.5925 to 0.6225
- Granger causality
- None
- Granger optimal lag
- 1
AI analysis
Analysis: Brent Crude Oil Prices vs. USD/Euro Exchange Rate
Relationship Overview
The scatterplot reveals a moderate positive relationship between Brent crude oil spot prices (X-axis, in USD/barrel) and the USD/Euro exchange rate (Y-axis). As oil prices rise, the Euro tends to strengthen against the dollar (a higher USD/Euro rate means more dollars per Euro, indicating dollar weakness). The linear regression equation y = 0.00313x + 0.979 confirms this directional relationship, though the shallow slope indicates the exchange rate response is muted relative to oil price swings. The data spans over 25 years (1999–2026), meaning this relationship has been tested across multiple commodity supercycles, financial crises, and geopolitical shocks.
Correlation Strength and Statistical Significance
With r = 0.608 and R² = 0.369, roughly 37% of the variance in the EUR/USD rate is explained by oil prices — a meaningful but far from dominant share, leaving 63% attributable to other forces. The 95% confidence interval [0.593, 0.623] is narrow, reflecting the large sample (n = 6,772), and the p-value of effectively zero confirms this correlation is not a statistical artifact. However, the Granger causality results undercut any causal narrative: neither X→Y (F = 0.382, p = 0.537) nor Y→X (F = 0.276, p = 0.599) achieves significance, meaning neither variable reliably predicts the other in the next period. The correlation is real in a cross-sectional sense but lacks the temporal lead-lag structure needed to claim predictive or causal directionality.
Patterns, Clusters, and Outliers
The sample points reveal notable heteroscedasticity: at low oil prices (X < 30), Y values cluster tightly near 0.90–1.10, while at higher prices (X 80), the vertical spread widens considerably (roughly 0.96 to 1.39 observed in the samples alone). This fan-shaped dispersion suggests the relationship becomes noisier at higher oil price levels. Several potential outliers are visible — points like (117.99, 1.39) and (118.90, 1.34) sit in the high-oil, high-Euro territory, while (82.55, 0.96) and (27.46, 0.89) appear as low-exchange-rate outliers for their respective oil price levels. These likely correspond to specific episodes such as the 2008 commodity spike, post-COVID recovery, or the 2022 energy crisis, where currency dynamics were driven by forces beyond oil fundamentals alone.
Confounding Factors and Caveats
Several structural confounders complicate this interpretation. Oil is priced in USD, so dollar weakness mechanically makes oil cheaper in other currencies, potentially boosting demand and price — creating a reflexive relationship rather than a clean unidirectional one. Eurozone vs. US monetary policy divergence (ECB vs. Fed rate differentials) is a primary driver of EUR/USD that operates largely independently of oil. Global risk sentiment can simultaneously push oil prices down and strengthen the dollar as a safe-haven currency (e.g., 2008, 2020 COVID crash), creating short-term negative correlations that the long-run positive trend obscures. The 25-year time span also means regime changes — the Euro's introduction, the shale revolution, OPEC+ formation — likely create structurally distinct sub-periods that a single linear model conflates.
Actionable Insights and Further Investigation
Given the moderate correlation but absent Granger causality, oil prices should not be used alone as a tactical predictor of EUR/USD movements. However, for macro scenario analysis or longer-horizon currency hedging, oil price regimes may still inform directional bias. Recommended next steps include: (1) segmenting the data by decade or regime to test whether the correlation is stable or driven by a specific era (likely the 2002–2008 commodity supercycle); (2) adding interest rate differentials and trade balance data as covariates to build a more complete model of EUR/USD; (3) testing non-linear models (e.g., piecewise regression or quantile regression) given the visible heteroscedasticity; and (4) examining whether the relationship strengthens at weekly or monthly aggregation, where Granger causality might emerge beyond the noise of daily data.
X dataset: Brent Daily Spot Prices
Y dataset: US Dollar to Euro Exchange Rate
Part of experiment: Daily - Brent Daily Spot Prices vs US Dollar to Euro Exchange Rate