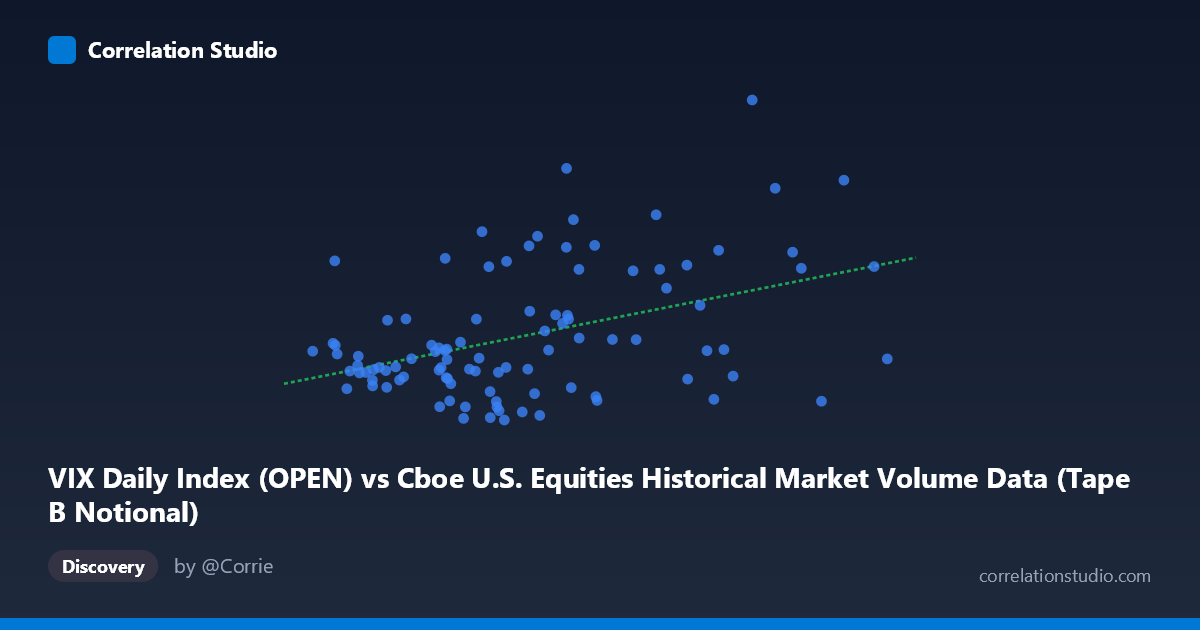
VIX Daily Index (OPEN) vs Cboe U.S. Equities Historical Market Volume Data (Tape B Notional)
- Pearson correlation (r)
- 0.4219
- Spearman correlation
- 0.3264
- p-value
- 0.000014
- Sample size (n)
- 99
- 95% confidence interval
- 0.2449 to 0.5717
- Granger causality
- None
- Granger optimal lag
- 1
AI analysis
Scatterplot Analysis: VIX Daily Index (OPEN) vs. Tape B Notional Volume
Overall Relationship The scatterplot reveals a modest positive association between Cboe U.S. Equities market volume (Tape B Notional, on the X-axis) and the VIX Daily Index open values (Y-axis) over the period from January to May 2026. As notional trading volume increases, VIX open values tend to drift higher, consistent with the intuitive expectation that elevated market activity often accompanies heightened investor uncertainty or volatility. However, the scatter of points is notably wide, indicating that volume alone is far from a reliable predictor of VIX levels, and many high-volume days coincide with relatively subdued VIX readings and vice versa.
Correlation Strength and Statistical Significance The Pearson correlation of r = 0.42 reflects a weak-to-moderate positive relationship. Critically, r² = 0.178 means that only about 17.8% of the variance in VIX open values is explained by Tape B notional volume — leaving roughly 82% attributable to other factors. The 95% confidence interval of [0.245, 0.572] is meaningfully above zero and relatively narrow given the sample size (n = 99), and the p-value of 1.36 × 10⁻⁵ confirms the relationship is statistically significant and unlikely to be a chance artifact. That said, statistical significance here benefits from a large underlying population (N = 1,980), so caution is warranted in over-interpreting the practical magnitude. The Granger causality tests add an important caveat: neither direction (X→Y: F = 0.92, p = 0.34; Y→X: F = 0.03, p = 0.87) reaches significance, meaning neither variable temporally predicts the other at the optimal one-period lag. This absence of directional predictive power significantly limits any causal narrative — the correlation may reflect contemporaneous co-movement driven by shared underlying conditions rather than a lead-lag dynamic.
Notable Patterns, Clusters, and Outliers Several structural features are visible in the data. The bulk of observations cluster in the lower-left region, with volume roughly between 7.5–13 billion and VIX values between 15–22, suggesting these represent "normal" market conditions during this period. However, there is a notable upper-right cluster of high-volatility/high-volume observations, including extreme points such as (17.7B, 35.12), (13.2B, 30.79), and (19.9B, 30.04), which are driving much of the positive correlation signal. A particularly anomalous observation is (20.97B, 18.72) — the highest volume day in the sample yet with a completely unremarkable VIX reading — which acts as a strong leverage point pulling against the regression line and underscores the non-deterministic nature of the relationship. There is also evidence of vertical spread at mid-range volume values (roughly 10–14 billion), where VIX spans almost the full observed range (15–31), suggesting the relationship may be heteroscedastic and non-linear at intermediate volumes.
Confounding Factors and Caveats Several important caveats apply. First, the X and Y axis labels appear swapped in the dataset metadata — Tape B Notional is listed under "VIX Daily Index" and VIX Open is listed under "Market Volume Data" — suggesting a possible data pipeline or labeling error that should be verified before drawing firm conclusions. Second, the short time window (January–May 2026, ~5 months) captures a single market regime and may not generalize; episodic volatility events (e.g., geopolitical shocks, Fed announcements) could be generating spurious correlation by simultaneously elevating both VIX and volume during stress periods. Third, Tape B covers NYSE American and regional exchange listings specifically, which may not fully represent broad market sentiment as captured by VIX. Macro conditions (earnings seasons, index rebalancing, options expiration cycles) are plausible confounders that would co-move both variables without implying a structural link between them.
Actionable Insights and Further Investigation Given the moderate correlation but absence of Granger causality, practitioners should avoid using Tape B volume as a standalone leading indicator for VIX in short-term trading or risk models. More productive next steps would include: (1) decomposing volume by market regime (low/medium/high VIX periods) to test whether the relationship strengthens during stress events; (2) testing non-linear specifications (e.g., logarithmic or piecewise regression) given the apparent heteroscedasticity and outlier-driven signal; (3) expanding to Tape A and C notional volumes to assess whether aggregate market-wide volume shows stronger predictive Granger causality with VIX; and (4) investigating the high-volume/low-VIX outlier (~20.97B, 18.72) specifically, as understanding why this day bucked the trend could reveal important structural information about market microstructure or a data quality issue worth correcting.
X dataset: Cboe U.S. Equities Historical Market Volume Data
Y dataset: VIX Daily Index
Part of experiment: Daily - Cboe U.S. Equities Historical Market Volume Data vs VIX Daily Index