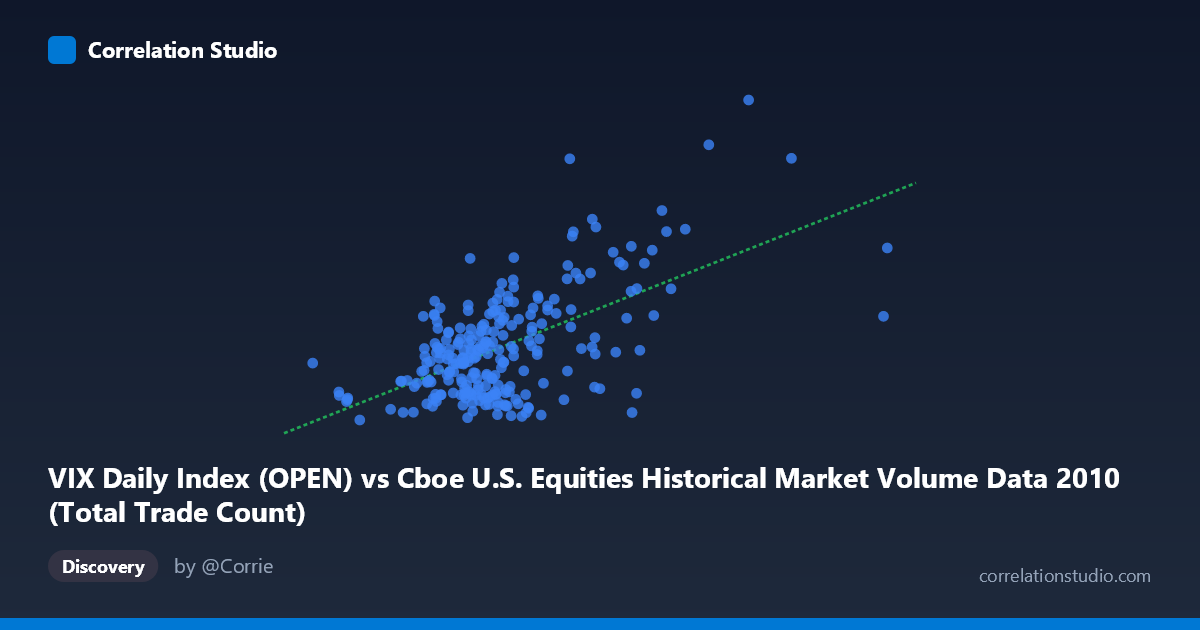
VIX Daily Index (OPEN) vs Cboe U.S. Equities Historical Market Volume Data 2010 (Total Trade Count)
- Pearson correlation (r)
- 0.5856
- Spearman correlation
- 0.4236
- p-value
- 0
- Sample size (n)
- 252
- 95% confidence interval
- 0.4981 to 0.6614
- Granger causality
- Y → X
- Granger optimal lag
- 1
AI analysis
Analysis: VIX Open vs. U.S. Equities Total Trade Count (2010)
Relationship Overview
The scatterplot reveals a moderate positive relationship between the CBOE Volatility Index (VIX) daily open values and U.S. equities total trade count across 2010 trading days. As the VIX increases — signaling greater expected market volatility — the total number of equity trades tends to rise as well. This is economically intuitive: elevated fear or uncertainty in markets typically drives higher trading activity as investors reposition, hedge, or react to news. The linear regression equation (y = 4.71×10⁻⁶x + 12.20) confirms a positive slope, though the relationship is far from deterministic, with considerable scatter visible across the full range of both variables.
Correlation Strength and Statistical Framing
The Pearson correlation of r = 0.586 indicates a moderate positive association, but the more telling metric is r² = 0.343, meaning that VIX open values explain only 34.3% of the variance in trade counts — leaving roughly two-thirds of the variation attributable to other factors. The 95% confidence interval [0.498, 0.661] is meaningfully wide, reflecting real uncertainty in the precise strength of this relationship even with n = 252 paired observations drawn from a population of N = 3,302. The p-value of effectively zero confirms this correlation is statistically significant and not a product of chance. Critically, the Granger causality results are asymmetric: Y (VIX) Granger-causes X (trade count) at lag 1 (F = 5.97, p = 0.015), while the reverse direction fails to reach significance (F = 1.85, p = 0.175). This suggests that yesterday's VIX level carries predictive information about today's trading volume, but not vice versa — a directional temporal signal consistent with volatility driving investor behavioral responses.
Notable Patterns, Clusters, and Outliers
The sample points reveal several distinct features. A dense cluster sits in the lower-left region (VIX ≈ 1.0M–2.5M, trade count ≈ 15–25), representing the majority of "calm" trading days in 2010. A second, sparser grouping emerges in the upper-right quadrant (VIX open 3.0M, trade count 28), corresponding to elevated-volatility episodes. Several notable outliers stand out: the point near (4,340,243; 47.66) and another near (4,002,972; 43.15) represent extreme readings on both axes simultaneously, likely coinciding with specific market stress events in 2010 (such as the May 6 Flash Crash). The point at (5,514,534; 32.76) is an extreme X-axis outlier with only moderately elevated trade count, suggesting the relationship is not strictly linear at extremes. Below VIX levels of ~2.5M, trade counts cluster tightly between 15 and 25, implying a potential floor effect in quiet market conditions.
Confounding Factors and Caveats
Several important caveats apply. First, the axes appear to be mislabeled or swapped in the source metadata: VIX is described as a column from the market volume dataset, and trade count from the VIX dataset — likely a data joining artifact that should be verified before drawing firm conclusions. Second, 2010 was not a typical year; it included the Flash Crash (May 6), European sovereign debt concerns, and QE2 announcements, all of which could produce spurious clustering of high-volatility, high-volume days that inflate the correlation. Third, secular intraday and day-of-week patterns in trade count are not controlled for here, nor are broader structural market changes such as algorithm adoption rates. Finally, Granger causality establishes temporal precedence, not true causation — a common driver (e.g., macroeconomic news releases) could simultaneously elevate VIX and subsequent trading volumes without a direct causal link.
Actionable Insights and Further Investigation
Practitioners and researchers should consider several next steps. Given the Granger causality result, VIX open levels could serve as a useful next-day trading volume predictor in volume-forecasting models, adding value for market makers and exchange operators managing capacity. However, a non-linear model (e.g., log-log or piecewise regression) should be tested, as the scatter suggests the linear fit underperforms at VIX extremes. It would be valuable to isolate the Flash Crash period and re-run the analysis to assess whether the correlation is driven primarily by tail events. Extending the analysis across multiple years would test whether this 2010 relationship is structurally stable or regime-dependent. Finally, introducing control variables — such as S&P 500 returns, news sentiment indices, or time-of-year fixed effects — in a multivariate framework could substantially improve the explained variance well beyond the current 34.3% ceiling.
X dataset: Cboe U.S. Equities Historical Market Volume Data 2010
Y dataset: VIX Daily Index
Part of experiment: Daily - Cboe U.S. Equities Historical Market Volume Data 2010 vs VIX Daily Index