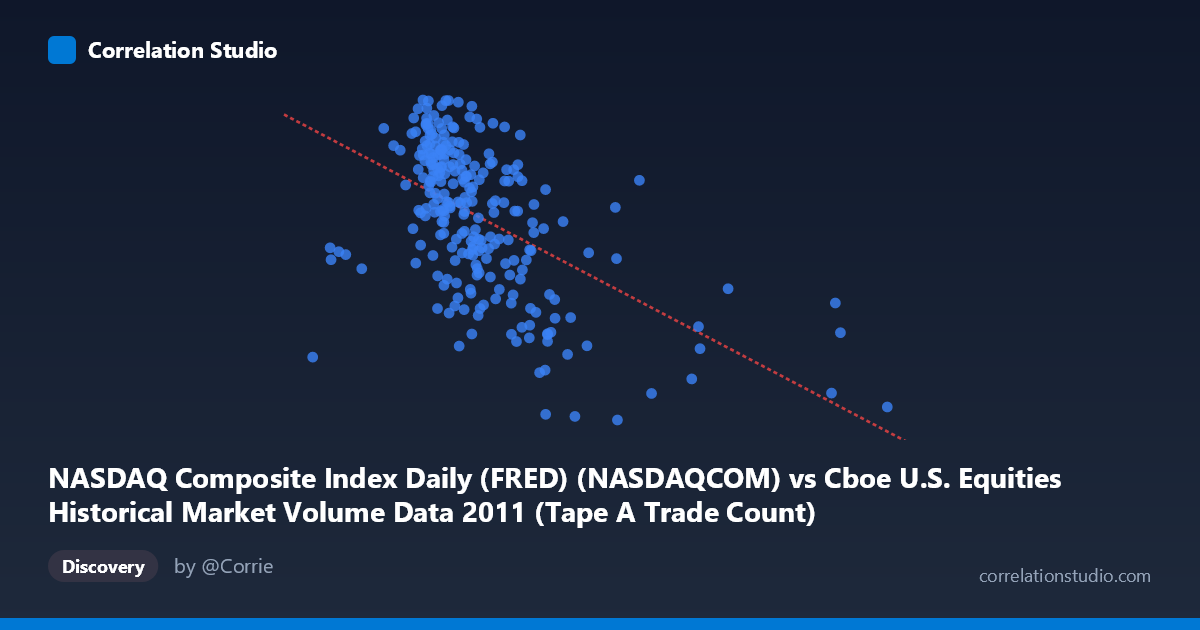
NASDAQ Composite Index Daily (FRED) (NASDAQCOM) vs Cboe U.S. Equities Historical Market Volume Data 2011 (Tape A Trade Count)
- Pearson correlation (r)
- -0.535
- Spearman correlation
- -0.5432
- p-value
- 0
- Sample size (n)
- 252
- 95% confidence interval
- -0.6177 to -0.4406
- Granger causality
- X → Y
- Granger optimal lag
- 10
AI analysis
Analysis: NASDAQ Composite Index vs. Cboe U.S. Equities Tape A Trade Count (2011)
Relationship Overview
The scatterplot reveals a moderate negative relationship between the NASDAQ Composite Index level and the Cboe U.S. Equities Tape A Trade Count throughout 2011. As the NASDAQ index rises, trade counts tend to decline, and vice versa. The linear regression equation (y = −0.000208547x + 2926.68) captures this inverse slope, suggesting that for every 1,000-point increase in the NASDAQ, the Tape A trade count decreases by roughly 208 units. This counter-intuitive inverse relationship — higher equity prices associated with fewer trades — is a well-documented market microstructure phenomenon, where rising bull markets often coincide with reduced urgency to trade and lower overall transaction volumes on individual exchanges.
Correlation Strength and Statistical Significance
The Pearson correlation of r = −0.535 indicates a moderate negative association, with r² = 0.286 meaning that approximately 28.6% of the variance in Tape A trade counts is explained by the NASDAQ index level alone. While statistically meaningful, this leaves roughly 71% of variance attributable to other factors. The 95% confidence interval of [−0.618, −0.441] is relatively tight and entirely negative, providing strong evidence that the true population correlation is genuinely inverse and not a sampling artifact. The p-value of effectively zero, drawn from a population of N = 3,780 daily observations, confirms this relationship is highly unlikely to be spurious. Critically, the Granger causality test supports a unidirectional temporal relationship: X (NASDAQ index) Granger-causes Y (trade count) at an optimal lag of 10 trading periods (F = 1.97, p = 0.038), while the reverse direction fails to reach significance (F = 0.317, p = 0.976). This implies that NASDAQ index movements carry predictive information about future trade counts approximately two weeks ahead, but trade count activity does not meaningfully predict subsequent index levels.
Notable Patterns, Clusters, and Outliers
Several structural features are visible in the sample data. There is a dense cluster of observations in the NASDAQ range of roughly 950,000–1,300,000 (in the dataset's native units) paired with trade counts between approximately 2,600 and 2,870, forming the core of the distribution. A distinct lower-right cluster of points appears at higher X values (above ~1,450,000) with trade counts falling below 2,550, consistent with the negative trend. A few notable outliers stand out: one point near X = 2,126,542 with a trade count of only ~2,493 sits far to the right of the main cluster, potentially representing an anomalous high-volume day or a data irregularity. Similarly, a point near X = 567,045 at a trade count of ~2,625 lies far to the left, possibly reflecting a market stress episode or index disruption. These extreme X values suggest the distribution is right-skewed, which could inflate the apparent correlation.
Confounding Factors and Interpretive Caveats
Several important caveats limit causal interpretation. First, 2011 was a highly volatile market year — marked by the U.S. debt ceiling crisis, S&P's U.S. credit downgrade in August, and European sovereign debt fears — meaning that the negative correlation may partly reflect a risk-off regime where falling equity prices coincide with panic-driven trading surges rather than a structural long-term relationship. Second, secular trends in market structure (e.g., algorithmic trading, fragmentation across venues) could simultaneously drive both variables in opposite directions, acting as a lurking third variable. Third, the mismatch in dataset descriptions (X-axis label and Y-axis label appear to have their dataset source annotations reversed) warrants a data integrity check before drawing firm conclusions. Finally, Granger causality establishes temporal precedence, not true economic causality — a common confound in financial time series where macroeconomic shocks drive both series simultaneously with different lags.
Actionable Insights and Further Investigation
The 10-period Granger lag is practically significant: NASDAQ index levels may serve as a leading indicator of Cboe Tape A trade activity roughly two weeks out, which could be valuable for exchange capacity planning, liquidity provisioning, or market-making strategy. Recommended next steps include: (1) segmenting the analysis by market regime (pre/post August 2011 credit downgrade) to test whether the correlation holds uniformly or is regime-dependent; (2) applying a log transformation to the X variable to address right-skew and potential non-linearity; (3) expanding to a multi-year panel to distinguish structural from cyclical drivers; and (4) incorporating additional predictors such as the VIX volatility index, which may account for much of the unexplained 71% variance and serve as a more proximate driver of both index levels and trade activity.
X dataset: Cboe U.S. Equities Historical Market Volume Data 2011
Y dataset: NASDAQ Composite Index Daily (FRED)
Part of experiment: Daily - Cboe U.S. Equities Historical Market Volume Data 2011 vs NASDAQ Composite Index Daily (FRED)