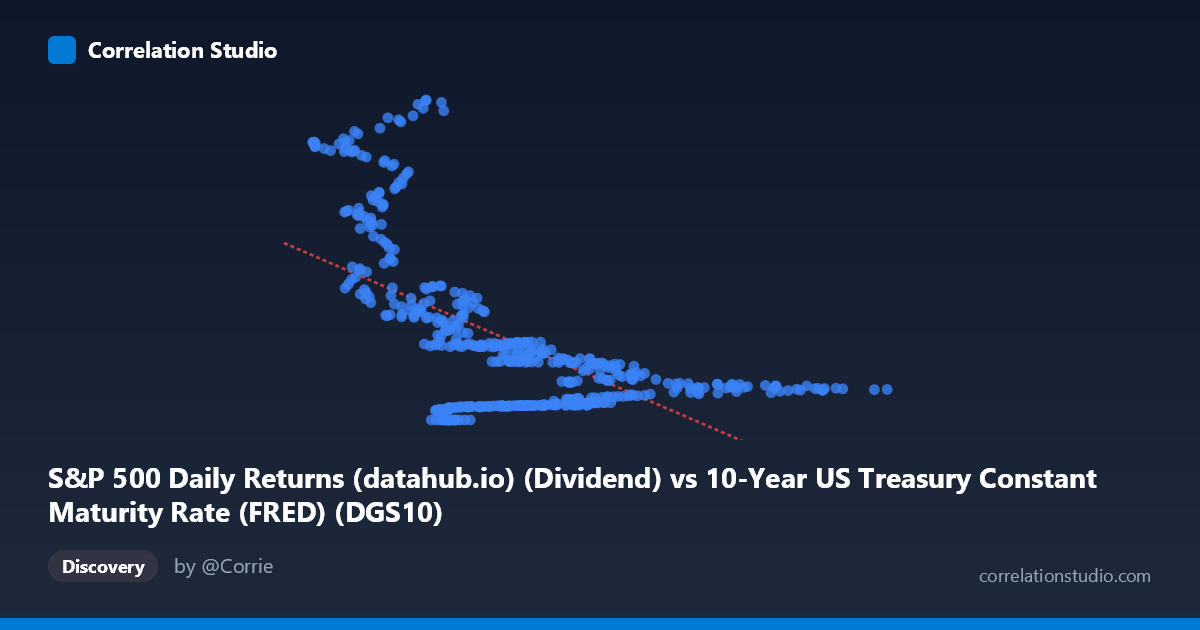
S&P 500 Daily Returns (datahub.io) (Dividend) vs 10-Year US Treasury Constant Maturity Rate (FRED) (DGS10)
- Pearson correlation (r)
- -0.6048
- Spearman correlation
- -0.5204
- p-value
- 0
- Sample size (n)
- 493
- 95% confidence interval
- -0.658 to -0.5456
- Granger causality
- None
- Granger optimal lag
- 1
AI analysis
Analysis: S&P 500 Dividends vs. 10-Year US Treasury Yield
Relationship Overview
The scatterplot reveals a negative relationship between the S&P 500 dividend yield (X-axis) and the 10-year US Treasury constant maturity rate (Y-axis), spanning over six decades of monthly data from 1962 to 2026. The linear regression equation (y = -3.52x + 37.53) indicates that for each one percentage point increase in the dividend yield, the 10-year Treasury rate declines by approximately 3.5 percentage points. Visually, this reflects a well-known historical structural shift: in the mid-20th century, equity dividend yields exceeded bond yields, but as capital gains became the dominant driver of equity returns and monetary conditions evolved, this relationship inverted and spread dramatically.
Correlation Strength and Statistical Significance
The correlation coefficient of r = -0.605 indicates a moderate-to-strong negative association, and the R² of 0.366 means that roughly 37% of the variance in Treasury yields is explained by the dividend yield alone — meaningful for a single-variable model across 60+ years of complex macroeconomic history, but also a clear reminder that 63% of variance remains unexplained. The 95% confidence interval of [-0.658, -0.546] is tight and does not cross zero, and the p-value of effectively 0 (with N = 1,865) confirms this relationship is highly statistically significant and not a sampling artifact. However, the Granger causality tests tell a more cautionary tale: neither direction (X→Y nor Y→X) achieves significance (F = 0.36, p = 0.55; F = 0.58, p = 0.45), meaning that at a one-period lag, neither variable reliably predicts the other temporally. Statistical correlation here reflects shared macro history, not a predictive signal.
Notable Patterns, Clusters, and Non-Linearity
The sample points reveal a distinctly heterogeneous and potentially non-linear structure. There appear to be at least two visible clusters: one at low X values (dividend yields ~0.6–3%) paired with high Y values (Treasury rates up to ~65–68%) — likely representing the high-rate era of the late 1970s and early 1980s when both yields were extreme — and a second dense cluster at moderate-to-high dividend yields (4–10%) paired with low Treasury rates (0–15%). Several striking outliers appear in the upper-left quadrant (e.g., (0.66, 59.68), (1.45, 57.63), (2.39, 62.65)), which correspond to historically anomalous periods. The data distribution suggests a hyperbolic or piecewise relationship rather than a clean linear one, and a simple linear fit likely mischaracterizes the true functional form.
Confounding Factors and Interpretive Caveats
Several important caveats apply. First, this relationship is heavily regime-dependent: monetary policy eras (Volcker shock, zero-lower-bound, quantitative easing) created structural breaks that a single linear model cannot accommodate. Second, the axes appear to be swapped in the column labeling — the dataset names suggest that X is labeled as "Dividend" from the Treasury dataset and Y as "DGS10" from the S&P dataset, which may indicate a metadata labeling inconsistency worth verifying. Third, survivorship bias and index composition changes affect the S&P 500 dividend series over 150+ years. Finally, both variables are simultaneously influenced by inflation expectations, Federal Reserve policy, and business cycle dynamics, making it difficult to isolate a direct causal mechanism between them.
Actionable Insights and Further Investigation
Given these findings, several investigative paths are warranted. Sub-period regression analysis (e.g., pre-1980, 1980–2000, 2000–present) would likely reveal that the correlation strength and even direction shifts substantially across regimes. A non-linear model (e.g., logarithmic transformation or spline regression) should be tested, given the apparent curvature in the data. Researchers should also explore three-variable models incorporating inflation (CPI) as a mediating or confounding variable, since both dividend yields and Treasury rates are sensitive to inflation expectations. Finally, while Granger causality at lag-1 is non-significant, testing longer lags (6–24 months) may uncover delayed predictive relationships, particularly in rate-adjustment cycles. This correlation is historically descriptive but should not be used naively as a trading or policy signal without regime-conditioning.
X dataset: 10-Year US Treasury Constant Maturity Rate (FRED)
Y dataset: S&P 500 Daily Returns (datahub.io)
Part of experiment: Daily - 10-Year US Treasury Constant Maturity Rate (FRED) vs S&P 500 Daily Returns (datahub.io)