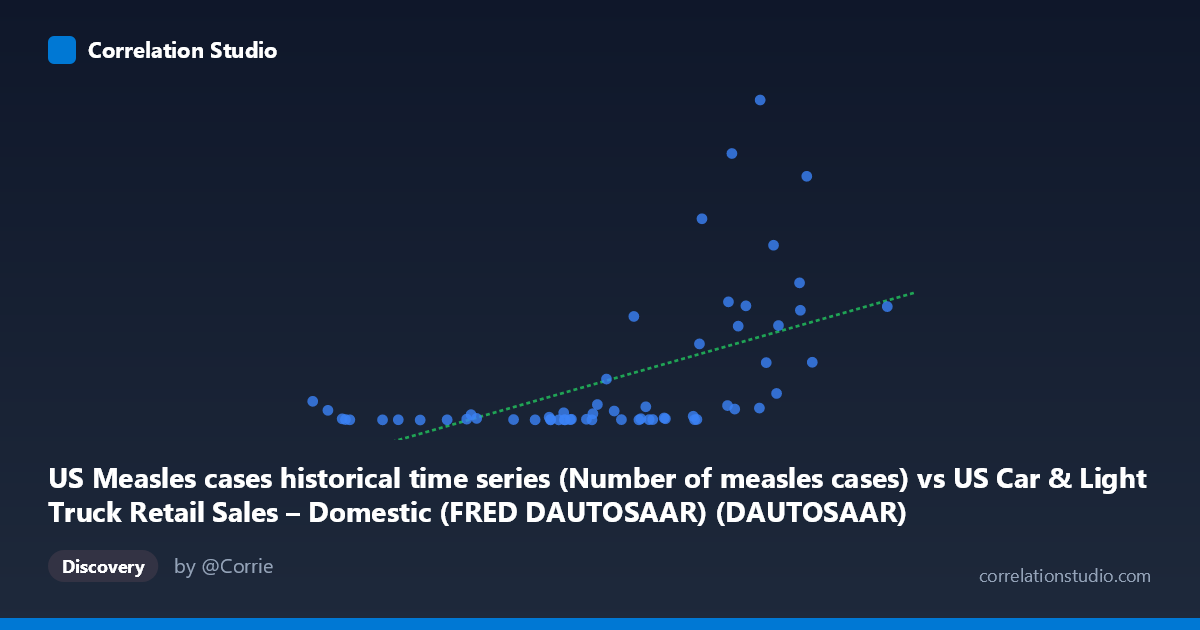
US Measles cases historical time series (Number of measles cases) vs US Car & Light Truck Retail Sales – Domestic (FRED DAUTOSAAR) (DAUTOSAAR)
- Pearson correlation (r)
- 0.547
- Spearman correlation
- 0.68
- p-value
- 0.000006
- Sample size (n)
- 60
- 95% confidence interval
- 0.3403 to 0.7032
- Granger causality
- None
- Granger optimal lag
- 10
AI analysis
Analysis: US Measles Cases vs. Domestic Auto Retail Sales
1. What the Visualization Reveals
The scatterplot displays a positive but highly dispersed relationship between US measles cases (X-axis) and domestic auto retail sales (Y-axis) across a time series spanning 1967–2026. While a general upward trend is visible through the linear regression line (y = 4578.88x − 18155.1), the data points scatter widely around this line, with enormous vertical spread particularly at moderate-to-high X values. This immediately signals that the relationship is weak-to-moderate at best, and almost certainly driven by shared temporal trends rather than any meaningful causal mechanism between the two variables.
2. Correlation Strength, Direction, and Statistical Framing
The Pearson r of 0.5511 indicates a moderate positive correlation, but the explanatory power is modest: R² = 0.3037 means only ~30.4% of the variance in auto sales is statistically explained by measles case counts, leaving nearly 70% unexplained. The 95% confidence interval for r [0.3455, 0.7062] is relatively wide, reflecting meaningful uncertainty in the true population correlation despite the statistically significant p-value (p = 5.055×10⁻⁶). That significance is largely a function of sample size (N = 93) rather than effect strength — a well-known artifact where large samples flag even weak associations as "significant." Critically, Granger causality analysis finds no significant predictive direction in either direction (X→Y: F = 1.41, p = 0.23; Y→X: F = 1.19, p = 0.34), meaning neither variable temporally predicts the other — there is no detectable lead-lag causal signal even at optimal lag = 10 periods.
3. Notable Patterns, Clusters, and Outliers
Several features stand out visually: - Extreme outliers are prominent at higher X values — points like (8.26, 75290), (7.84, 62705), (7.39, 47351), and (8.95, 57345) show extremely high Y values that heavily influence the regression slope and inflate the correlation - A dense low-Y cluster exists across the full X range (~1.6–9.0), where hundreds of observations fall below Y = 5,000, suggesting the relationship is fundamentally non-linear - The Spearman ρ exceeding Pearson r confirms this non-linearity — a logarithmic or power transformation of Y would likely yield a better fit and more honest representation of the association - Low X values (measles cases near 0–3) show scattered but non-trivial Y values, inconsistent with a simple linear model
4. Confounding Factors and Caveats
This correlation is almost certainly spurious, driven by shared long-term temporal trends rather than any real-world connection between measles epidemiology and automobile consumer demand. Both series are time-indexed from 1967–2026: measles cases declined dramatically after vaccine introduction in 1963 (reaching near-elimination by the 1980s) while auto sales followed macroeconomic cycles. Any shared trend — whether declining, cyclical, or structural — can produce correlation coefficients of this magnitude. Additional confounders include: - Secular time trends (both variables indexed to overlapping historical periods) - Economic cycles independently affecting auto sales - Public health policy shifts independently affecting measles counts - The mismatch in data granularity (monthly auto sales vs. annual measles cases) introduces aggregation artifacts
The wide CI and non-significant Granger results further underscore that this is a correlation of coincidence, not mechanism.
5. Actionable Insights and Further Investigation
Rather than treating this as a meaningful bivariate relationship, the appropriate next steps include: (1) detrending both series (e.g., first-differencing or removing shared time trends) before recalculating correlation to isolate genuine co-movement from secular drift; (2) applying a log transformation to Y (measles cases span 13–75,290 — over three orders of magnitude), which would address non-linearity flagged by the Spearman/Pearson discrepancy; (3) running a multivariate analysis controlling for year/decade as a covariate to test whether any residual correlation survives detrending; and (4) treating this correlation as a textbook example of spurious correlation — useful pedagogically for illustrating why temporal co-occurrence and statistical significance alone are insufficient evidence of meaningful relationships without theoretical grounding and causal testing.
X dataset: US Car & Light Truck Retail Sales – Domestic (FRED DAUTOSAAR)
Y dataset: US Measles cases historical time series
Part of experiment: Yearly - US Car & Light Truck Retail Sales – Domestic (FRED DAUTOSAAR) vs US Measles cases historical time series