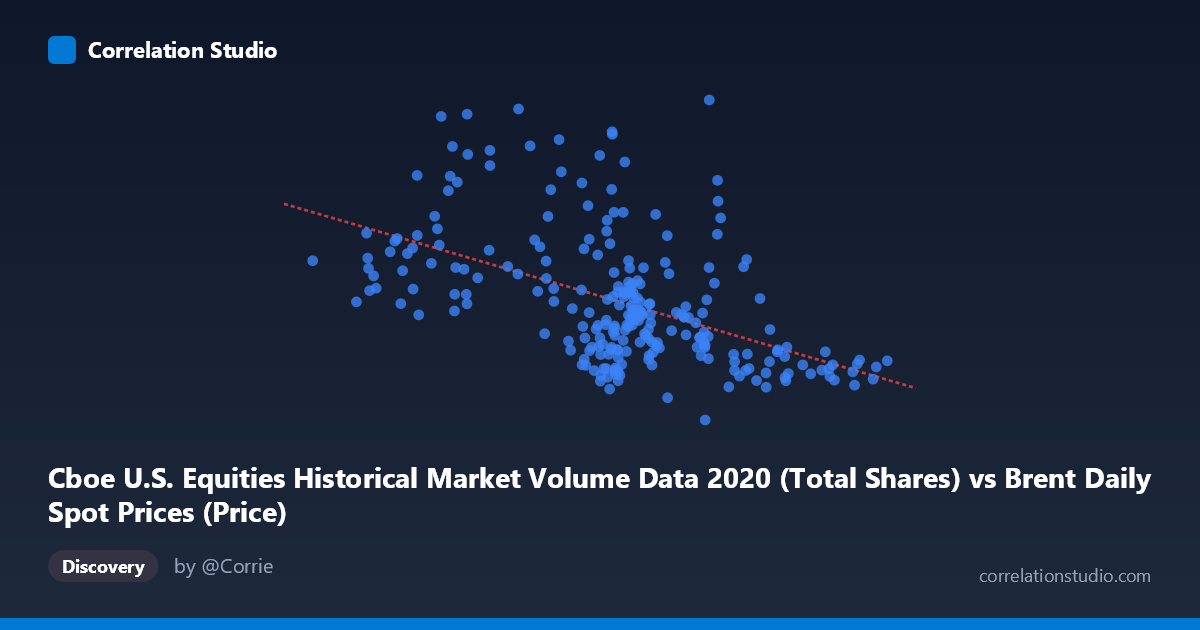
Cboe U.S. Equities Historical Market Volume Data 2020 (Total Shares) vs Brent Daily Spot Prices (Price)
- Pearson correlation (r)
- -0.5065
- Spearman correlation
- -0.5231
- p-value
- 0
- Sample size (n)
- 250
- 95% confidence interval
- -0.5933 to -0.4081
- Granger causality
- None
- Granger optimal lag
- 10
AI analysis
Scatterplot Analysis: Cboe U.S. Equity Market Volume vs. Brent Crude Oil Spot Prices (2020)
Relationship Overview
The scatterplot reveals a moderate negative relationship between U.S. equity market trading volume (total shares) and Brent crude oil spot prices across the 2020 trading year. As equity market volume increases, oil prices tend to decline — and conversely, lower-volume trading days are associated with higher oil prices. The linear regression equation (y = -7,543,510x + 969,827,000) captures this downward trend, though the scatter around the regression line is substantial, indicating the relationship is real but far from deterministic. Visually, the data points form a diffuse cloud with a discernible downward slope, suggesting the negative association is genuine but noisy.
Correlation Strength and Statistical Significance
The Pearson correlation of r = -0.5065 indicates a moderate negative association. However, the R² value of 0.2566 is the more practically important figure: it means that only 25.7% of the variance in Brent oil prices is explained by equity trading volume, leaving roughly three-quarters of price variation attributable to other factors entirely. The 95% confidence interval for r spans [-0.5933, -0.4081] — entirely negative and reasonably tight — affirming that the negative direction is reliable, not a statistical artifact. The p-value of essentially zero (from n = 250 drawn from N = 4,254) confirms the correlation is highly statistically significant. That said, Granger causality tests find no significant predictive relationship in either direction (X→Y: F = 1.11, p = 0.358; Y→X: F = 0.53, p = 0.867), meaning that neither variable's past values meaningfully predict the other's future values at the tested lag of 10 periods. This critically distinguishes correlation from temporal predictive utility.
Notable Patterns, Clusters, and Outliers
Several features stand out in the sample data. There is a notable cluster of moderate-volume days (X ≈ 40–45) with wide Y-spread ranging roughly from ~430M to ~1,040M barrels in price, indicating that mid-range volume days are highly heterogeneous in oil price outcomes. A handful of high-volume, low-price outliers appear at the upper-right of the X-axis (e.g., X ≈ 62–67, Y ≈ 456M–483M), consistent with the March–April 2020 COVID market turmoil when equity volumes surged amid the oil price crash. Conversely, low-volume days (X ≈ 14–27) tend to cluster at higher oil prices (Y ≈ 630M–843M), consistent with calmer, pre-disruption or late-year recovery conditions. Two particularly prominent outliers — (35.33, 1,100,893,146) and (42.33, 1,039,247,771) — sit well above the regression line and may represent specific geopolitical or macroeconomic shock events.
Confounding Factors and Interpretive Caveats
The 2020 dataset is deeply confounded by the COVID-19 pandemic, which simultaneously triggered historic equity market volatility (driving volume to record highs) and caused an unprecedented oil demand collapse (with Brent briefly going negative in WTI terms in April 2020). This means the observed negative correlation may largely reflect a common response to a shared external shock rather than any structural or causal link between equity volumes and oil prices. Additionally, the dataset mixes datasets from different domains — Brent prices from EIA energy data with Cboe U.S. equity volume — and the column label cross-referencing in the dataset names warrants careful verification to ensure the variables are correctly aligned. Seasonal effects, OPEC supply decisions, Federal Reserve policy responses, and currency fluctuations are all plausible omitted variables that could explain much of the remaining 74% variance.
Actionable Insights and Further Investigation
Given the lack of Granger causality, neither variable should be used as a leading indicator of the other in a trading or forecasting context without additional supporting signals. Further investigation should include: (1) regime-segmentation analysis — splitting the data into pre-COVID (Jan–Feb), crash (Mar–Apr), and recovery (May–Dec) periods to test whether the correlation holds across regimes or is driven entirely by the crash period; (2) adding confounders such as VIX (volatility index), USD index, and OPEC announcement dates to build a multivariate model that pushes R² substantially above 25.7%; and (3) testing non-linear specifications (e.g., logarithmic or piecewise regression), given the visible heteroscedasticity in the mid-volume cluster. A cross-year validation using 2018–2019 data would also clarify whether this relationship is a 2020-specific artifact or a more persistent structural feature.
X dataset: Brent Daily Spot Prices
Y dataset: Cboe U.S. Equities Historical Market Volume Data 2020
Part of experiment: Daily - Brent Daily Spot Prices vs Cboe U.S. Equities Historical Market Volume Data 2020