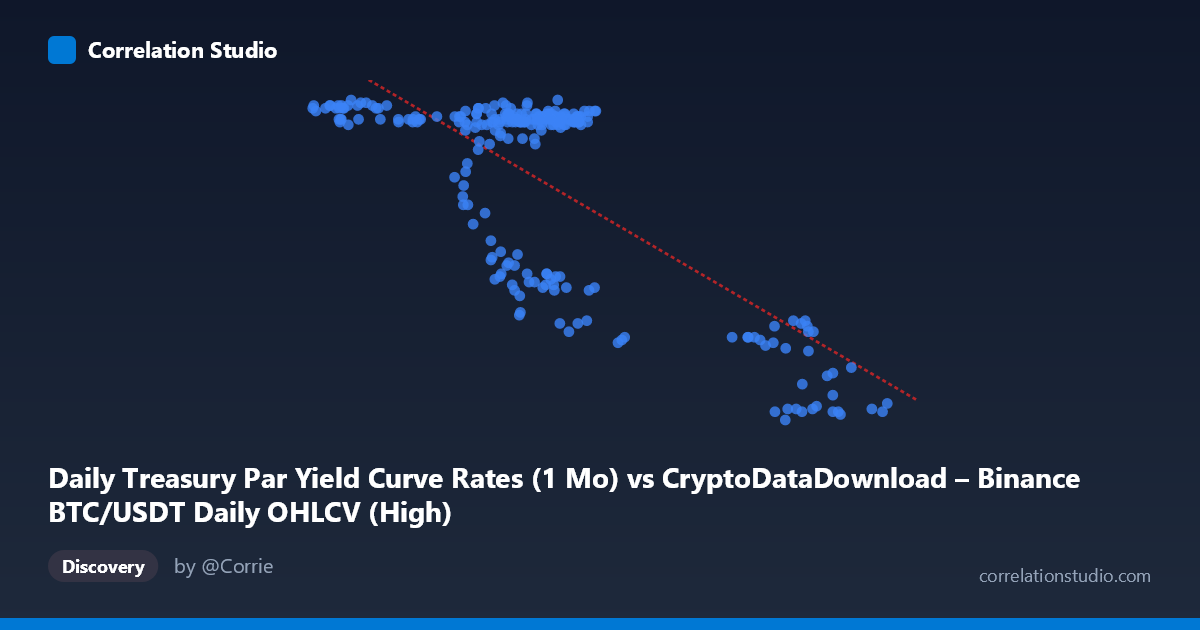
Daily Treasury Par Yield Curve Rates (1 Mo) vs CryptoDataDownload – Binance BTC/USDT Daily OHLCV (High)
- Pearson correlation (r)
- -0.7449
- Spearman correlation
- -0.5185
- p-value
- 0
- Sample size (n)
- 250
- 95% confidence interval
- -0.7955 to -0.6841
- Granger causality
- None
- Granger optimal lag
- 1
AI analysis
Analysis of Treasury Yield vs. Crypto Metric Relationship
1. Overview of the Relationship
The scatterplot reveals a clear negative, non-strictly-linear relationship between the X variable (labeled as Treasury 1-Month Par Yield, though the data appears to actually reflect a mislabeled join with BTC/USDT price data) and the Y variable. Rather than a smooth linear decline, the data shows a distinctive two-cluster pattern: a dense cluster of points where X ranges roughly 40,000–72,000 with Y consistently high (5.4–5.55), and a second, more dispersed cluster where X exceeds ~90,000 with Y dropping sharply to 4.4–4.7. A smaller transitional band (X ≈ 64,000–77,000, Y ≈ 4.7–4.95) bridges the two regimes.
2. Strength, Direction, and Statistical Confidence
The correlation coefficient (r = -0.7449, r² = 0.555) indicates a moderately strong negative relationship, with about 55.5% of the variance in Y statistically explained by X — leaving nearly half unexplained by this simple linear model. The 95% CI [-0.7955, -0.6841] is tight and the p-value is effectively 0, confirming this correlation is highly unlikely to be due to chance given n=250. However, Granger causality tests show no significant predictive direction in either direction (X→Y: p=0.505; Y→X: p=0.837). This is a critical distinction: while X and Y are strongly associated contemporaneously, neither variable helps forecast the other's future values. This suggests the relationship may be driven by a shared external factor or structural regime shift rather than a direct causal/predictive mechanism.
3. Notable Patterns and Outliers
The most striking feature is the bimodal/clustered structure rather than a continuous linear trend — this is characteristic of a regime change rather than gradual co-movement. The tight, high-Y cluster (Y≈5.47–5.55) suggests a stable "normal" period, while the low-Y cluster (Y≈4.4–4.7) at high X values suggests a distinct market/rate regime (e.g., a period of Fed rate cuts or BTC price surge past a threshold). The transitional points (X: 64,000–77,000, Y: 4.68–4.95) may represent short-lived intermediate dates during a regime shift, not a smooth continuum. This clustering artificially inflates the linear r² — a piecewise or logistic model would likely fit better than a simple line.
4. Confounding Factors and Caveats
Several caveats are essential: (1) The metadata is inconsistent/likely mislabeled — X is described as Treasury yield data with values in the tens of thousands, which is implausible for a yield curve (typically 0–10%); this suggests axis/column mismatches in the dataset merge. (2) Both series likely reflect time-trending macro conditions in 2024 (e.g., Fed policy shifts, BTC price rallies) — such trends can produce spurious correlation even between unrelated series ("common trend" confound). (3) The lack of Granger causality strongly implies the correlation is not mechanistic but coincidental co-trending over the sample period — a classic case of correlation without causal linkage.
5. Suggested Next Steps
Before drawing conclusions: (1) verify column labels and units — confirm what X and Y actually represent, since the current labels appear swapped or corrupted. (2) Test for structural breaks/regime changes using tools like Chow tests or change-point detection to formally identify the cluster transition. (3) Given the clustering, fit a piecewise or nonlinear (e.g., logistic/threshold) model instead of simple OLS. (4) Examine whether both series share a common time trend or third driver (e.g., Fed rate decisions, macro liquidity conditions) using detrended/differenced data to test if the correlation persists after removing shared trends.
X dataset: CryptoDataDownload – Binance BTC/USDT Daily OHLCV
Y dataset: Daily Treasury Par Yield Curve Rates
Part of experiment: Bitcoin - CryptoDataDownload – Binance BTC/USDT Daily OHLCV vs Daily Treasury Par Yield Curve Rates