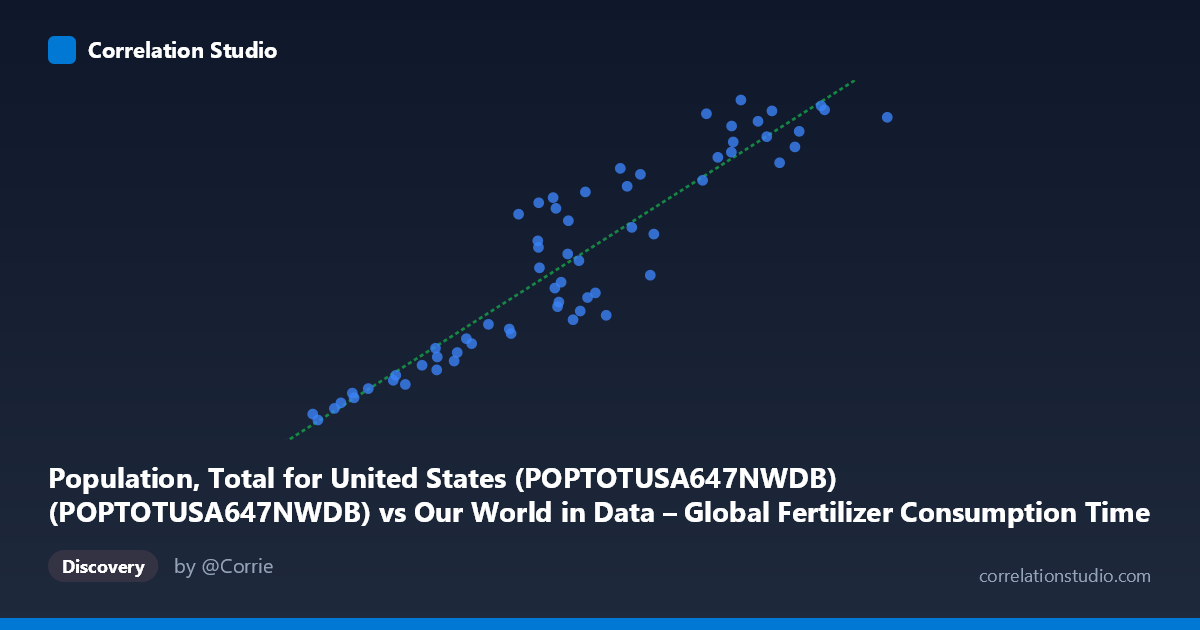
Population, Total for United States (POPTOTUSA647NWDB) (POPTOTUSA647NWDB) vs Our World in Data – Global Fertilizer Consumption Time Series (1961–2023) (All fertilizers use)
- Pearson correlation (r)
- 0.9294
- Spearman correlation
- 0.9216
- p-value
- 0
- Sample size (n)
- 63
- 95% confidence interval
- 0.8855 to 0.9568
- Granger causality
- None
- Granger optimal lag
- 10
- Time coverage
- 1961-01-01 to 2023-01-01
AI analysis
Scatterplot Analysis: U.S. Population vs. Global Fertilizer Consumption (1961–2023)
1. Overall Relationship Revealed
The scatterplot displays a strong, positive, and largely linear relationship between total U.S. population and global fertilizer consumption over the period 1961–2023. As the U.S. population has grown from roughly 183 million to 337 million, global fertilizer use has risen correspondingly from approximately 3.2 million to 22.7 million (in the units represented on the X-axis). The data points trace a coherent upward trajectory across six decades, suggesting that both variables have been marching steadily forward through time together. The linear regression equation y = 8.91x + 153,351,000 fits the data reasonably well visually, with most observations clustering tightly around the regression line, particularly in the mid-range of both variables.
2. Correlation Strength, Direction, and Causality
The Pearson correlation of r = 0.9294 indicates a very strong positive association, and the coefficient of determination r² = 0.8637 tells us that approximately 86.4% of the variance in global fertilizer consumption is statistically explained by U.S. population size within this linear model — a remarkably high figure. The 95% confidence interval of [0.8855, 0.9568] is narrow and sits entirely in the high-positive range, confirming that this strong correlation is estimated with considerable precision and is not an artifact of sample size alone. The p-value of essentially zero confirms the result is statistically significant far beyond conventional thresholds. However — and this is critical — the Granger causality tests reveal no significant temporal predictive relationship in either direction (X→Y: F = 1.66, p = 0.133; Y→X: F = 1.91, p = 0.081). Neither variable meaningfully predicts the future values of the other once its own history is accounted for, which directly undermines any causal narrative. The correlation reflects co-movement through time, not a mechanistic or directional link.
3. Patterns, Clusters, and Notable Features
Examining the scatter more closely, a few structural features stand out. The data points at the lower-left end (smaller population, lower fertilizer use — roughly pre-1980 observations) appear slightly more scattered and occasionally fall below the regression line, suggesting the linear fit is somewhat less precise in earlier decades. Conversely, the upper-right cluster (approximately population 18 million on the X-axis, corresponding to post-2005 years) shows several points that deviate noticeably upward from the trend line — including observations near (18.8M, 331.6M), (20.5M, 334.0M), and (22.7M, 328.5M) — hinting at a possible plateau or deceleration in fertilizer growth relative to population in the most recent years. The mid-range observations (population 10–15 million) display the tightest clustering around the line, indicating the linear model performs best in the middle decades. No single dramatic outlier is apparent, but the upper-right spread suggests the relationship may be becoming slightly non-linear or saturating in recent years.
4. Confounding Factors and Interpretive Caveats
The most fundamental caveat here is that both variables are primarily proxies for the passage of time. U.S. population and global fertilizer consumption have both grown monotonically (or near-monotonically) over 1961–2023, meaning their high correlation is largely a spurious temporal co-trend rather than evidence of any meaningful connection. Dozens of other time-trending variables — global GDP, internet adoption rates, CO₂ emissions, urban land area — would correlate equally strongly with either variable for the same reason. The Granger causality failure makes this explicit: there is no detectable lead-lag relationship, confirming the correlation is driven by shared time trend rather than any predictive mechanism. Additionally, global fertilizer consumption is driven by factors entirely external to U.S. population dynamics: agricultural policy in China and India (the world's largest fertilizer consumers), global food price cycles, energy costs (fertilizer production is energy-intensive), and Green Revolution technology diffusion. Meanwhile, U.S. population growth is shaped by domestic birth rates and immigration policy. These two systems have no plausible direct linkage.
5. Actionable Insights and Further Investigation
Given the spurious nature of this correlation, the most productive next steps would focus on disentangling the shared time trend from any genuine relationship. Researchers should consider detrending both series (e.g., using first differences or per-capita normalization) before re-examining the correlation — it is likely that the residual correlation after detrending would be substantially weaker. It would also be worth disaggregating global fertilizer data by country, particularly examining whether U.S. domestic fertilizer consumption (rather than global totals) shows any more meaningful association with U.S. population. Plotting fertilizer consumption per capita globally against time might reveal whether recent observed plateauing in the upper-right cluster reflects genuine efficiency improvements or demand saturation. Finally, multivariate analysis incorporating true agricultural drivers — cropland area, crop yields, global food demand, nitrogen use efficiency — would provide a far more explanatory model than population alone and would help identify whether U.S. population carries any independent predictive signal once those substantive factors are controlled.
X dataset: Our World in Data – Global Fertilizer Consumption Time Series (1961–2023)
Y dataset: Population, Total for United States (POPTOTUSA647NWDB)
Part of experiment: Yearly - Our World in Data – Global Fertilizer Consumption Time Series (1961–2023) vs Population, Total for United States (POPTOTUSA647NWDB)