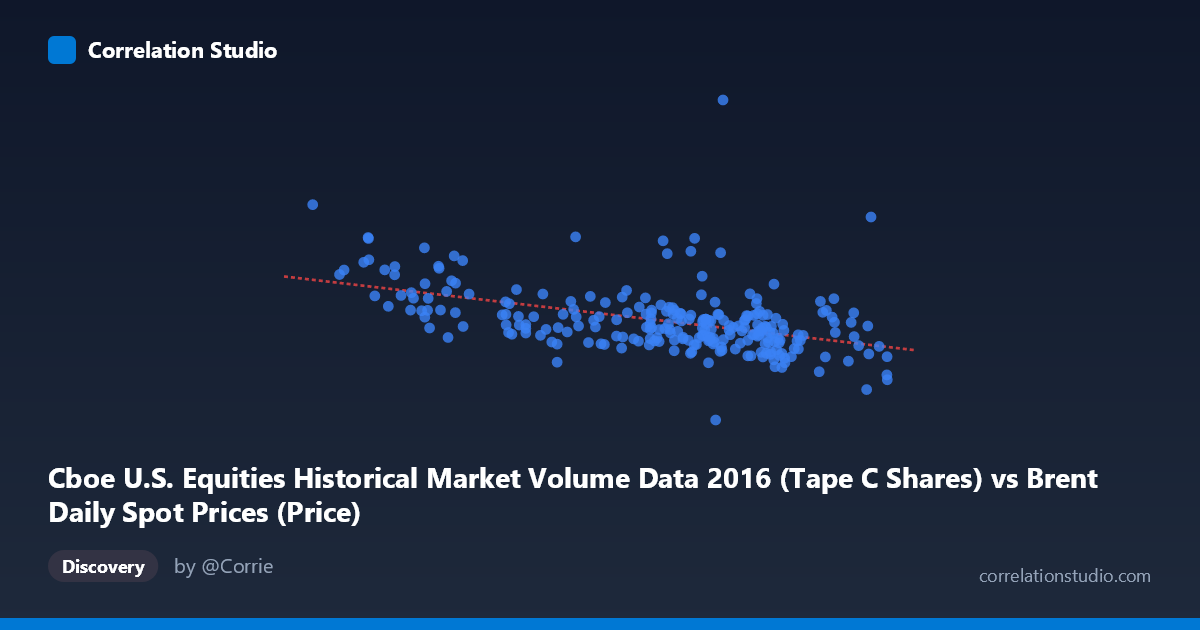
Cboe U.S. Equities Historical Market Volume Data 2016 (Tape C Shares) vs Brent Daily Spot Prices (Price)
- Pearson correlation (r)
- -0.4706
- Spearman correlation
- -0.4989
- p-value
- 0
- Sample size (n)
- 251
- 95% confidence interval
- -0.5617 to -0.3683
- Granger causality
- None
- Granger optimal lag
- 10
AI analysis
Scatterplot Analysis: Brent Crude Oil Prices vs. Cboe U.S. Equities Market Volume (2016)
1. Overall Relationship
The scatterplot reveals a moderate negative relationship between Brent crude oil spot prices (USD/barrel) and Cboe U.S. equities market volume (shares traded). As oil prices increase across their observed range (~$26–$55/barrel), equity trading volume tends to decline. The linear regression equation (y = -1,913,290x + 216,692,000) quantifies this inverse slope, suggesting that each $1 increase in Brent crude is associated with approximately 1.91 million fewer shares traded on average. This pattern is visually apparent in the scatterplot, where lower oil price observations cluster around higher volume readings, and higher oil price observations are associated with more modest volume levels.
2. Correlation Strength, Direction, and Statistical Significance
The correlation of r = -0.4706 indicates a moderate negative association, but the variance explained metric provides critical grounding: r² = 0.2215 means only 22.1% of the variance in equity trading volume is explained by oil price movements. The remaining ~78% of variance arises from other factors entirely, underscoring that this is far from a deterministic relationship. The 95% confidence interval of [-0.5617, -0.3683] is meaningfully away from zero and reasonably tight, reflecting the large population size (N = 3,622) and adequate sample (n = 251). The p-value of 3.109×10⁻¹⁵ confirms the correlation is highly statistically significant — essentially ruling out chance as an explanation. However, Granger causality tests find no significant temporal predictive direction in either direction (X→Y: F = 0.52, p = 0.87; Y→X: F = 0.64, p = 0.78 at optimal lag = 10 periods). This is a crucial nuance: while the cross-sectional correlation is statistically robust, neither variable meaningfully predicts the other's future values, suggesting the relationship is contemporaneous and likely driven by shared underlying forces rather than direct causation.
3. Notable Patterns, Clusters, and Outliers
Several structural features are visible in the data. The bulk of observations cluster in the $40–$52 oil price range with trading volumes concentrated between approximately 100M–160M shares, forming a relatively dense core. A distinct high-volume, low-price cluster appears at the lower end of the oil price axis (roughly $26–$35/barrel), where volume readings are notably elevated — some exceeding 175M–228M shares. The extreme point near (26.01, 228,954,616) stands out as a potential outlier and corresponds to the early-2016 oil price crash period, when markets experienced heightened volatility and panic-driven volume spikes. Conversely, higher oil prices (~$48–$54) are associated with a compressed, lower-volume band, with a few observations near $99–$107M shares suggesting a volume floor. The relationship appears somewhat heteroscedastic, with greater volume dispersion at lower oil prices.
4. Confounding Factors and Interpretive Caveats
Several important caveats apply. First, 2016 was a structurally unusual year for both oil and equities: it encompassed the tail of an oil price collapse (early 2016 lows near $26/barrel), a recovery, and significant macro events including Brexit (June) and the U.S. presidential election (November) — all of which independently drove extreme equity volume. The high-volume, low-price observations likely reflect market stress and uncertainty rather than oil prices causing volume changes. Second, reverse causality or common-factor confounding is plausible: macro risk sentiment, USD strength, and global growth expectations simultaneously influence both crude oil prices and investor trading activity. Third, Cboe Tape C volume is one segment of U.S. equity markets, potentially introducing measurement scope limitations. Finally, the absence of Granger causality strongly suggests the observed correlation is spurious or coincidental in a temporal sense, driven by overlapping time-period effects rather than any direct economic mechanism.
5. Actionable Insights and Further Investigation
Given the moderate but structurally interesting correlation, several avenues merit further investigation. Controlling for market volatility (VIX) and macro risk proxies (e.g., credit spreads, USD index) would help isolate whether the oil–volume relationship persists independently, or whether it collapses once stress regimes are accounted for. A regime-based analysis separating the oil crash period (Q1 2016) from the recovery phase would clarify whether the correlation is driven primarily by that structural break or is consistent across the year. Researchers should also consider testing broader market volume metrics (total U.S. equity volume) to assess whether the Tape C finding generalizes. Finally, since Granger causality fails at lag 10, testing shorter lags and intraday data might reveal whether any short-term predictive signal exists that daily aggregation masks. The primary practical takeaway is that oil price levels should not be used as a standalone trading volume predictor, but may serve as one signal within a broader macro-driven market activity model.
X dataset: Brent Daily Spot Prices
Y dataset: Cboe U.S. Equities Historical Market Volume Data 2016
Part of experiment: Daily - Brent Daily Spot Prices vs Cboe U.S. Equities Historical Market Volume Data 2016