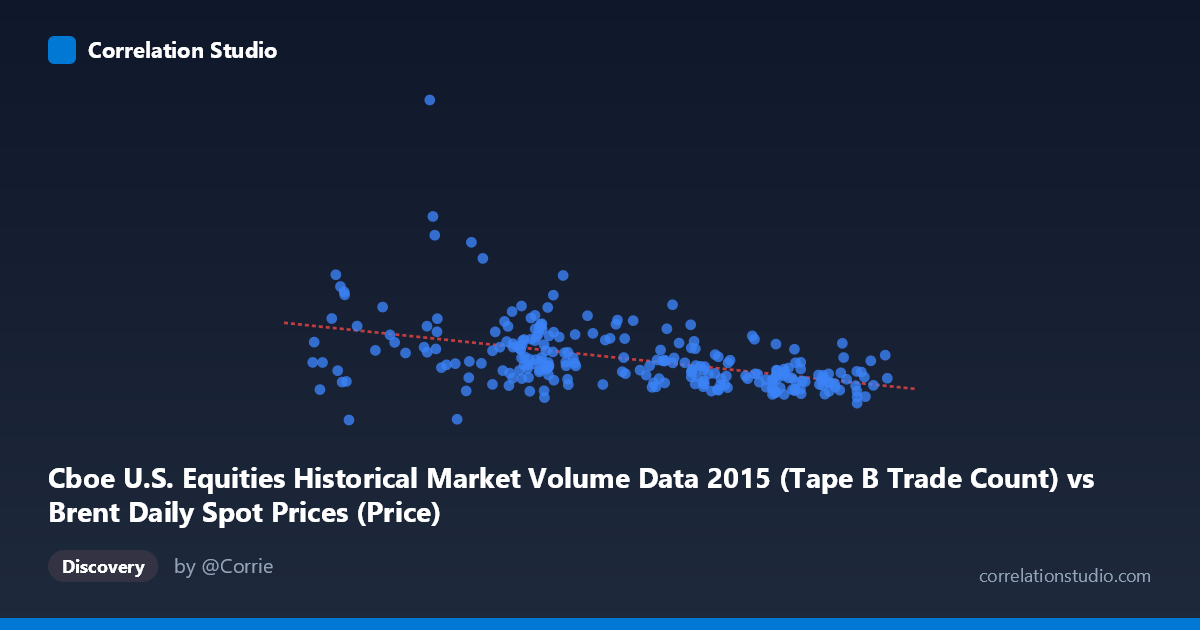
Cboe U.S. Equities Historical Market Volume Data 2015 (Tape B Trade Count) vs Brent Daily Spot Prices (Price)
- Pearson correlation (r)
- -0.4573
- Spearman correlation
- -0.516
- p-value
- 0
- Sample size (n)
- 251
- 95% confidence interval
- -0.55 to -0.3535
- Granger causality
- None
- Granger optimal lag
- 10
AI analysis
Scatterplot Analysis: Cboe Tape B Trade Count vs. Brent Crude Oil Spot Price (2015)
Relationship Overview
The scatterplot reveals a moderate negative relationship between Cboe U.S. Equities Tape B trade count and Brent crude oil daily spot prices across 2015. The linear regression (y = -5352.37x + 579,091) illustrates that as equity trade counts increase, Brent crude prices tend to decline. This inverse pattern is visually apparent in the data cloud, where higher X values (trade counts in the 60–66 range) cluster around lower Y values (roughly $175,000–$325,000 price units), while lower trade counts concentrate around a broader, often higher price range. The relationship is meaningful but clearly imperfect, with substantial scatter throughout.
Correlation Strength and Statistical Interpretation
The Pearson correlation of r = -0.4573 indicates a moderate negative association. However, the R² of 0.2091 is the critical interpretive anchor here — trade count explains only about 20.9% of the variance in Brent crude prices, meaning nearly 79% of price variation is driven by other factors entirely. The 95% confidence interval of [-0.55, -0.35] is reasonably tight and does not cross zero, and the p-value of 2.24×10⁻¹⁴ confirms this correlation is highly statistically significant given a sample of 251 observations drawn from a population of 3,302 trading days. That said, statistical significance here reflects precision of estimation, not causal strength. Most importantly, Granger causality tests find no significant predictive directionality in either direction (X→Y: F=0.61, p=0.80; Y→X: F=0.72, p=0.71), meaning neither variable temporally predicts the other at the optimal 10-period lag. The correlation, while real, does not support a predictive or causal narrative.
Notable Patterns, Clusters, and Outliers
Several features stand out in the scatter distribution. The bulk of observations cluster between trade counts of 44–52, forming a dense vertical band with wide Y-axis spread — suggesting that at moderate trading volumes, Brent prices were highly variable throughout 2015. At higher trade counts (60+), the price range compresses noticeably downward, consistent with the negative slope. A handful of notable outliers are visible at lower X values (roughly 43–46) with unusually high Y values exceeding 500,000–620,000 — points like (43.84, 621,009) and (41.86, 640,679) deviate substantially from the regression line and likely represent specific market events where crude prices spiked amid lower equity trading activity. These outliers may disproportionately influence the regression slope and deserve individual scrutiny.
Confounding Factors and Caveats
Several important caveats apply. First, this is a cross-dataset correlation — Tape B trade count is an equity market microstructure metric, while Brent crude is a commodity price; any shared variation likely reflects common macroeconomic or market sentiment drivers (e.g., risk-off episodes, OPEC announcements, USD strength) rather than any direct mechanism between the two. Second, 2015 was a particularly volatile year for crude oil (prices fell sharply mid-year), meaning temporal autocorrelation and trending in both series could be inflating the apparent correlation. Third, Tape B specifically covers regional exchanges (NYSE MKT, NYSE Arca, etc.) and may partially reflect energy sector ETF or commodity-linked equity activity, introducing indirect linkages. The absence of Granger causality despite a significant contemporaneous correlation strongly suggests a common latent driver rather than any direct relationship.
Actionable Insights and Further Investigation
Given the moderate correlation and the absence of Granger causality, practitioners should not use Tape B trade counts as a predictive signal for crude oil prices (or vice versa). Instead, further investigation should focus on identifying the shared latent variable driving both — candidates include VIX (market volatility), USD index movements, or broad risk appetite indicators. It would be worthwhile to decompose both time series to remove trend components and test whether the correlation persists in detrended or seasonally adjusted data. Additionally, the high-leverage outliers at low trade counts warrant event-study analysis to determine whether specific macro announcements explain them. Finally, extending the analysis beyond 2015 or across different crude benchmarks (WTI) could confirm whether this pattern is structural or specific to 2015's oil market crash dynamics.
X dataset: Brent Daily Spot Prices
Y dataset: Cboe U.S. Equities Historical Market Volume Data 2015
Part of experiment: Daily - Brent Daily Spot Prices vs Cboe U.S. Equities Historical Market Volume Data 2015