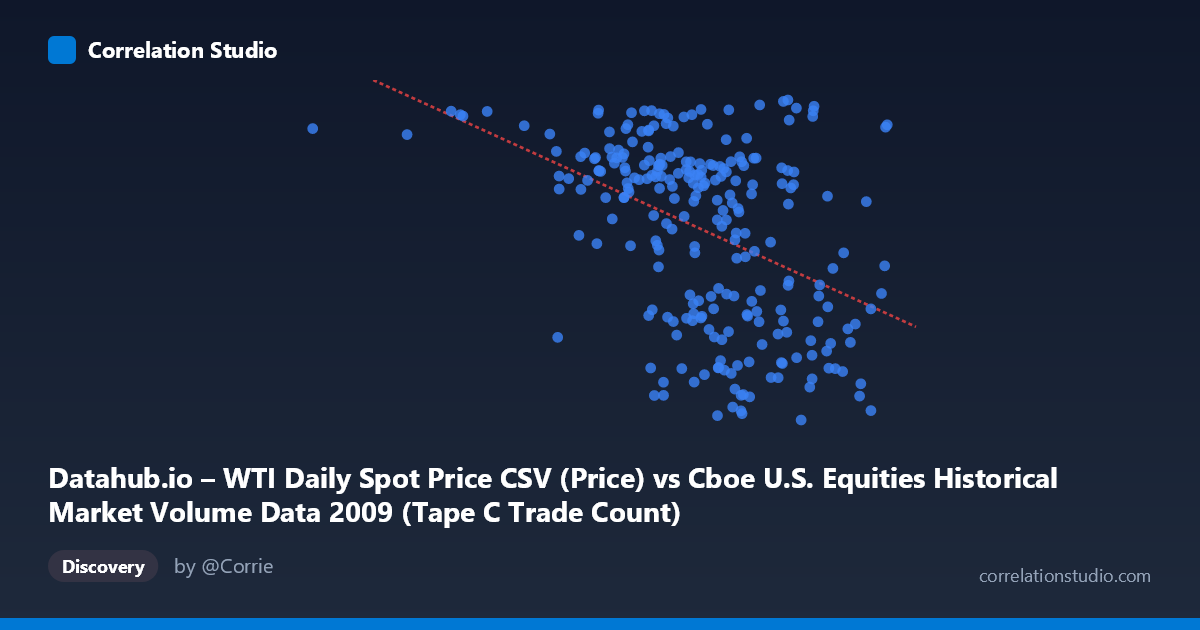
Datahub.io – WTI Daily Spot Price CSV (Price) vs Cboe U.S. Equities Historical Market Volume Data 2009 (Tape C Trade Count)
- Pearson correlation (r)
- -0.4325
- Spearman correlation
- -0.43
- p-value
- 0
- Sample size (n)
- 252
- 95% confidence interval
- -0.5279 to -0.3264
- Granger causality
- None
- Granger optimal lag
- 1
AI analysis
Scatterplot Analysis: WTI Oil Price vs. Cboe Tape C Trade Count (2009)
Relationship Overview
The scatterplot reveals a moderate negative relationship between WTI crude oil daily spot prices (X-axis) and Cboe U.S. Equities Tape C trade counts (Y-axis) across 2009. As oil prices increase, equity trade counts on Tape C tend to decline, and the linear regression equation (y = −5.79×10⁻⁵x + 98.77) confirms this inverse slope. Visually, the data points form a downward-sloping cloud, though with considerable scatter around the regression line, suggesting the relationship is real but far from deterministic. The wide spread of points across all price levels indicates that many other forces are simultaneously shaping trade activity.
Correlation Strength, Direction, and Statistical Significance
The Pearson correlation of r = −0.43 indicates a moderate negative association, but the explanatory power is limited: r² = 0.187, meaning oil prices account for only 18.7% of the variance in Tape C trade counts, leaving over 80% explained by other factors. The 95% confidence interval of [−0.528, −0.326] is entirely negative and does not cross zero, lending strong directional confidence. The p-value of 6.5×10⁻¹³ is extraordinarily small given N = 3,232, confirming this is not a chance finding. However, the Granger causality tests tell a more sobering story — neither direction shows significant temporal predictive power (X→Y: F = 1.36, p = 0.24; Y→X: F = 1.82, p = 0.18). This means that while the two variables are statistically correlated contemporaneously, past oil prices do not reliably predict future trade counts and vice versa, substantially limiting any causal or forecasting interpretation.
Notable Patterns, Clusters, and Outliers
Several features stand out in the point cloud. There is a visible cluster of high trade-count observations (Y ≈ 65–81) concentrated in the lower oil price range (roughly X = 380,000–600,000), consistent with the early-2009 period when oil prices were depressed following the 2008 financial crisis and equity market volatility — and thus trading activity — was elevated. Conversely, low trade counts (Y ≈ 35–50) appear predominantly at higher oil price values (X 700,000), consistent with mid-to-late 2009 as oil recovered and market volatility normalized. One notable outlier is the point near (185,887, 76.83), which sits far to the left of the main cluster and likely represents an anomalous single trading day with an unusually low price reading. A few high-X, high-Y points (e.g., ~743,745, 79.84 and ~764,138, 80.11) also deviate from the general trend, suggesting episodes where both oil prices and trade activity were simultaneously elevated.
Confounding Factors and Interpretive Caveats
This correlation almost certainly reflects shared temporal dynamics rather than a direct mechanistic link between oil prices and Tape C trade volume. Both variables were heavily influenced by the broader trajectory of the 2008–2009 financial crisis and recovery: early 2009 saw depressed oil prices, high market fear, and intense equity trading, while later 2009 saw recovering oil prices and calming markets. This creates a spurious correlation driven by a common third factor — macroeconomic conditions and investor risk sentiment — rather than oil prices directly causing changes in trade counts. Additionally, Tape C specifically covers NYSE Arca-listed securities, which may have unique compositional biases (e.g., ETFs, tech stocks) that respond to market stress differently than the broader market. The axis labels also appear swapped in the dataset metadata (price labeled under the trade-count dataset and vice versa), which warrants verification before drawing firm conclusions.
Actionable Insights and Further Investigation
Despite the non-causal Granger result, the contemporaneous correlation is robust enough to warrant deeper investigation. A natural next step would be to control for the VIX (volatility index) or a broader market stress indicator to test whether the oil–trade-volume relationship persists after accounting for shared macroeconomic dynamics. Researchers should also examine whether lagged relationships emerge over longer lag windows beyond the single-period lag tested here, as commodity price effects on equity market behavior may operate over weeks rather than days. Segmenting the data by market regime (crisis vs. recovery phases of 2009) could reveal whether the correlation is stable across the year or driven entirely by the early-2009 stress period. Finally, extending this analysis to multiple years would determine whether 2009's unique crisis context is essential to the observed pattern or whether a more durable structural relationship exists between energy prices and equity market microstructure.
X dataset: Cboe U.S. Equities Historical Market Volume Data 2009
Y dataset: Datahub.io – WTI Daily Spot Price CSV
Part of experiment: Daily - Cboe U.S. Equities Historical Market Volume Data 2009 vs Datahub.io – WTI Daily Spot Price CSV