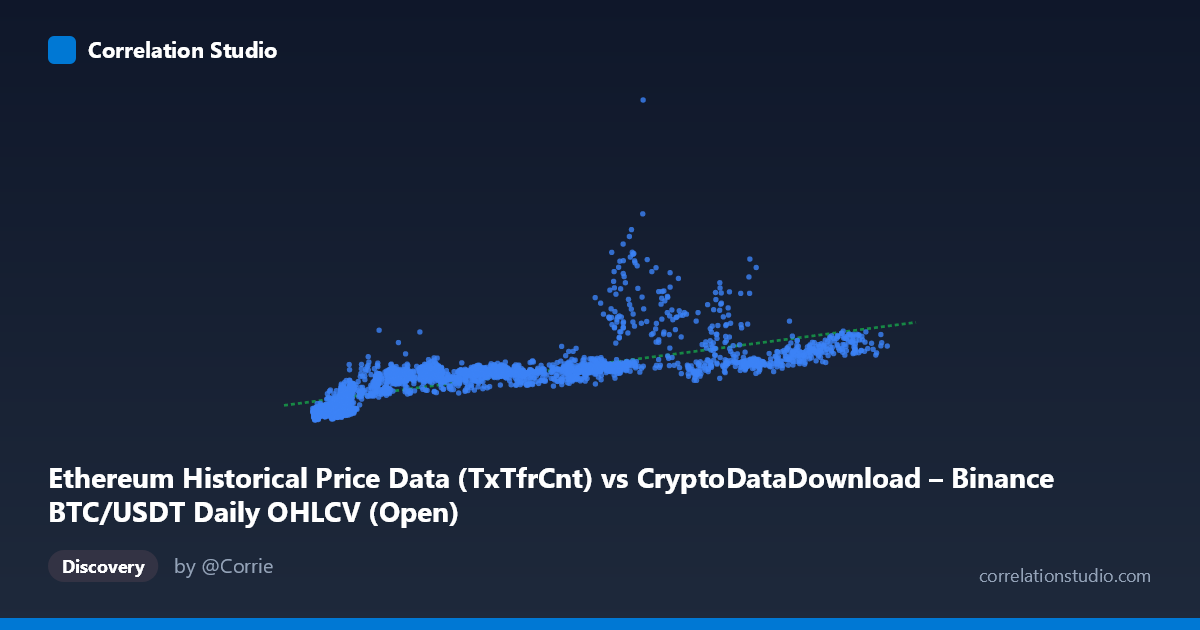
Ethereum Historical Price Data (TxTfrCnt) vs CryptoDataDownload – Binance BTC/USDT Daily OHLCV (Open)
- Pearson correlation (r)
- 0.7561
- Spearman correlation
- 0.9038
- p-value
- 0
- Sample size (n)
- 3191
- 95% confidence interval
- 0.7409 to 0.7706
- Granger causality
- None
- Granger optimal lag
- 10
AI analysis
Scatterplot Analysis: BTC/USDT Transaction Count vs. Ethereum Open Price
1. Relationship Overview
The visualization plots what appear to be mislabeled or cross-referenced fields (the axis labels suggest a data-mapping inconsistency between Ethereum transaction counts and BTC/USDT pricing), but treating the data as presented, it shows a clear positive, moderately-strong relationship. As X increases from roughly 3,000 to 125,000, Y rises from the low hundred-thousands to over 5 million, with the bulk of points clustering in the lower-left quadrant (X < 30,000; Y < 1,000,000) and a thinning, more scattered tail extending toward higher X values.
2. Strength, Direction, and Statistical Confidence
The Pearson correlation (r = 0.756) indicates a strong positive linear association, with r² = 0.572 meaning 57% of the variance in Y is explained by X — substantial, but leaving nearly half the variance driven by other factors or noise. The tight 95% confidence interval [0.741, 0.771] and p-value effectively at 0 confirm this correlation is highly statistically reliable and not a product of sampling noise, especially given the large sample size (n = 3,191). However, statistical significance should not be conflated with causal or predictive strength: the Granger causality tests show no significant predictive direction in either direction (X→Y: p = 0.51; Y→X: p = 0.55). This is an important distinction — the variables move together contemporaneously but neither reliably forecasts the other over time, suggesting the relationship may be driven by a shared external factor (e.g., overall crypto market cycles) rather than one variable mechanically leading the other.
3. Patterns, Clusters, and Non-linearity
The scatter shows a fan-shaped/heteroskedastic pattern: variance in Y increases substantially as X grows, producing a "megaphone" spread rather than a uniform linear band. Several notable high-Y outliers appear at moderate X values (e.g., X≈68,000 with Y≈2,698,591; X≈80,900 with Y≈1,847,022; X≈67,600 with Y≈1,815,531), indicating episodes where Y spiked disproportionately relative to X — likely reflecting market volatility events or bubble-like price action decoupled from the X metric. The note that Spearman's ρ exceeds Pearson's r is a key signal: the relationship is monotonic but not strictly linear, and a logarithmic or power-law model would likely fit better, especially given the multiplicative/percentage-based nature of crypto price and volume movements.
4. Confounding Factors and Caveats
Several caveats apply. First, both series span overlapping crypto bull/bear cycles (2017–2026), so the correlation may largely reflect a common macro trend (overall market cap growth, BTC dominance cycles, or shared investor sentiment) rather than a direct mechanistic link. Second, the axis metadata appears inconsistent/mismatched (transaction count vs. price fields crossing datasets), so the "X" and "Y" labels may not represent what they claim — this should be verified before drawing domain conclusions. Third, cryptocurrency prices are known to exhibit volatility clustering, fat tails, and regime shifts (e.g., 2018, 2021-22, 2024 cycles), which can inflate correlation during co-trending bull/bear periods while masking true independence in calmer periods.
5. Recommendations for Further Investigation
- Verify data provenance/labeling to ensure X and Y correspond to their intended metrics before drawing domain-specific conclusions. - Fit a log-log or polynomial regression given the Spearman/Pearson discrepancy and heteroskedastic fan pattern; this should improve explained variance substantially. - Segment analysis by market regime (bull vs. bear periods) to check if the correlation is regime-dependent rather than stable. - Investigate the high-Y outliers (e.g., the ~2.7M point) as potential flash-crash/pump events or data errors. - Given the null Granger result, avoid using either series as a leading indicator for the other; instead, explore shared external drivers (e.g., total crypto market cap, BTC volume, macro liquidity conditions) as a more robust causal framework.
X dataset: CryptoDataDownload – Binance BTC/USDT Daily OHLCV
Y dataset: Ethereum Historical Price Data
Part of experiment: Bitcoin - CryptoDataDownload – Binance BTC/USDT Daily OHLCV vs Ethereum Historical Price Data