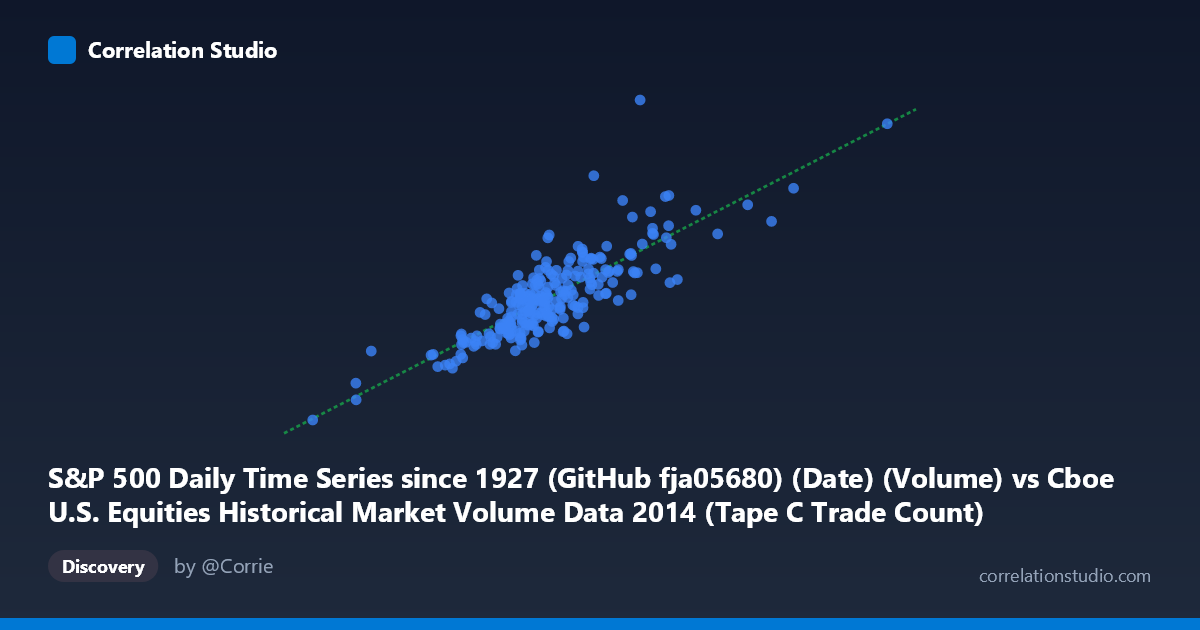
S&P 500 Daily Time Series since 1927 (GitHub fja05680) (Date) (Volume) vs Cboe U.S. Equities Historical Market Volume Data 2014 (Tape C Trade Count)
- Pearson correlation (r)
- 0.8272
- Spearman correlation
- 0.7993
- p-value
- 0
- Sample size (n)
- 252
- 95% confidence interval
- 0.7837 to 0.8626
- Granger causality
- None
- Granger optimal lag
- 10
AI analysis
Analysis: S&P 500 Trading Volume vs. Cboe Tape C Trade Count (2014)
Relationship Overview The scatterplot reveals a strong positive linear relationship between daily S&P 500 trading volume and Cboe U.S. Equities Tape C trade count across 2014. As total market volume increases, the number of discrete trades recorded on Tape C rises commensurately, which is conceptually intuitive — higher overall market participation tends to manifest as more individual transactions rather than simply larger block trades. The linear regression (y = 5037.59x + 82,440,400) fits the data reasonably well across much of the central range, though notable scatter exists at both tails.
Correlation Strength and Statistical Significance The Pearson correlation of r = 0.8272 indicates a strong positive association, and the R² of 0.6843 means that approximately 68.4% of the variance in Tape C trade count is explained by S&P 500 volume — a substantial but incomplete explanation. The remaining ~31.6% of variance is attributable to other factors. The 95% confidence interval of [0.7837, 0.8626] is relatively narrow given the sample size of n = 252, and the p-value of effectively zero confirms this relationship is statistically robust and not a chance artifact. However, the Granger causality results are notable and cautionary: neither direction (X→Y nor Y→X) achieves significance at the optimal 10-period lag (F = 0.96, p = 0.48 for X→Y; F = 1.11, p = 0.36 for Y→X). This means that while the two series are strongly correlated contemporaneously, neither variable meaningfully predicts the other's future values, suggesting they are co-driven by common underlying forces rather than one causing the other.
Patterns, Clusters, and Outliers The bulk of observations cluster in a moderately tight central band — roughly X: 550,000–750,000 volume and Y: 2.8B–3.9B trade count — consistent with typical 2014 trading conditions. Several high-leverage outliers are visible in the upper-right quadrant, most prominently points near (1,041,591; 5.07B) and (844,812; 4.96B), which represent unusually high-activity days likely tied to specific market events (e.g., volatility spikes, index rebalancing, or macro announcements). A notable low-end outlier at approximately (269,296; 1.42B) anchors the lower-left and appears to be a holiday-adjacent or otherwise anomalous low-volume session. The scatter also widens at higher volume levels, suggesting mild heteroscedasticity — the relationship becomes less precise as volume grows, possibly because extreme-volume days involve diverse transaction structures.
Confounding Factors and Caveats Several important caveats apply. First, both variables are likely jointly driven by market volatility (e.g., VIX spikes), macro news events, or seasonal patterns — explaining the strong correlation without implying direct causation. Second, the Tape C designation covers NYSE Arca-listed securities specifically, meaning it captures only a subset of total U.S. equity activity; compositional shifts in trading venue preference during 2014 could distort the relationship. Third, the dataset spans only a single calendar year (2014), which was characterized by relatively low volatility for most of the year with discrete spikes — this limits generalizability to other market regimes. Finally, the S&P 500 volume series from GitHub (Yahoo Finance sourced) may carry known data quality issues for historical volume figures, particularly around corporate actions.
Actionable Insights and Further Investigation Practitioners interested in market microstructure should investigate what drives the unexplained ~31.6% variance — candidates include VIX levels, options expiration cycles, Federal Reserve announcement days, and ETF creation/redemption activity. It would be worthwhile to extend this analysis across multiple years to test whether the r ≈ 0.83 relationship is stable or regime-dependent. The absence of Granger causality suggests that using one series to forecast the other in isolation would be unreliable; a multivariate model incorporating volatility measures would likely perform significantly better. Additionally, decomposing the outlier high-volume days by date could reveal whether specific event types (earnings seasons, geopolitical events) systematically break the linear relationship, which has direct implications for intraday liquidity modeling and execution strategy.
X dataset: Cboe U.S. Equities Historical Market Volume Data 2014
Y dataset: S&P 500 Daily Time Series since 1927 (GitHub fja05680) (Date)
Part of experiment: Daily - Cboe U.S. Equities Historical Market Volume Data 2014 vs S&P 500 Daily Time Series since 1927 (GitHub fja05680) (Date)